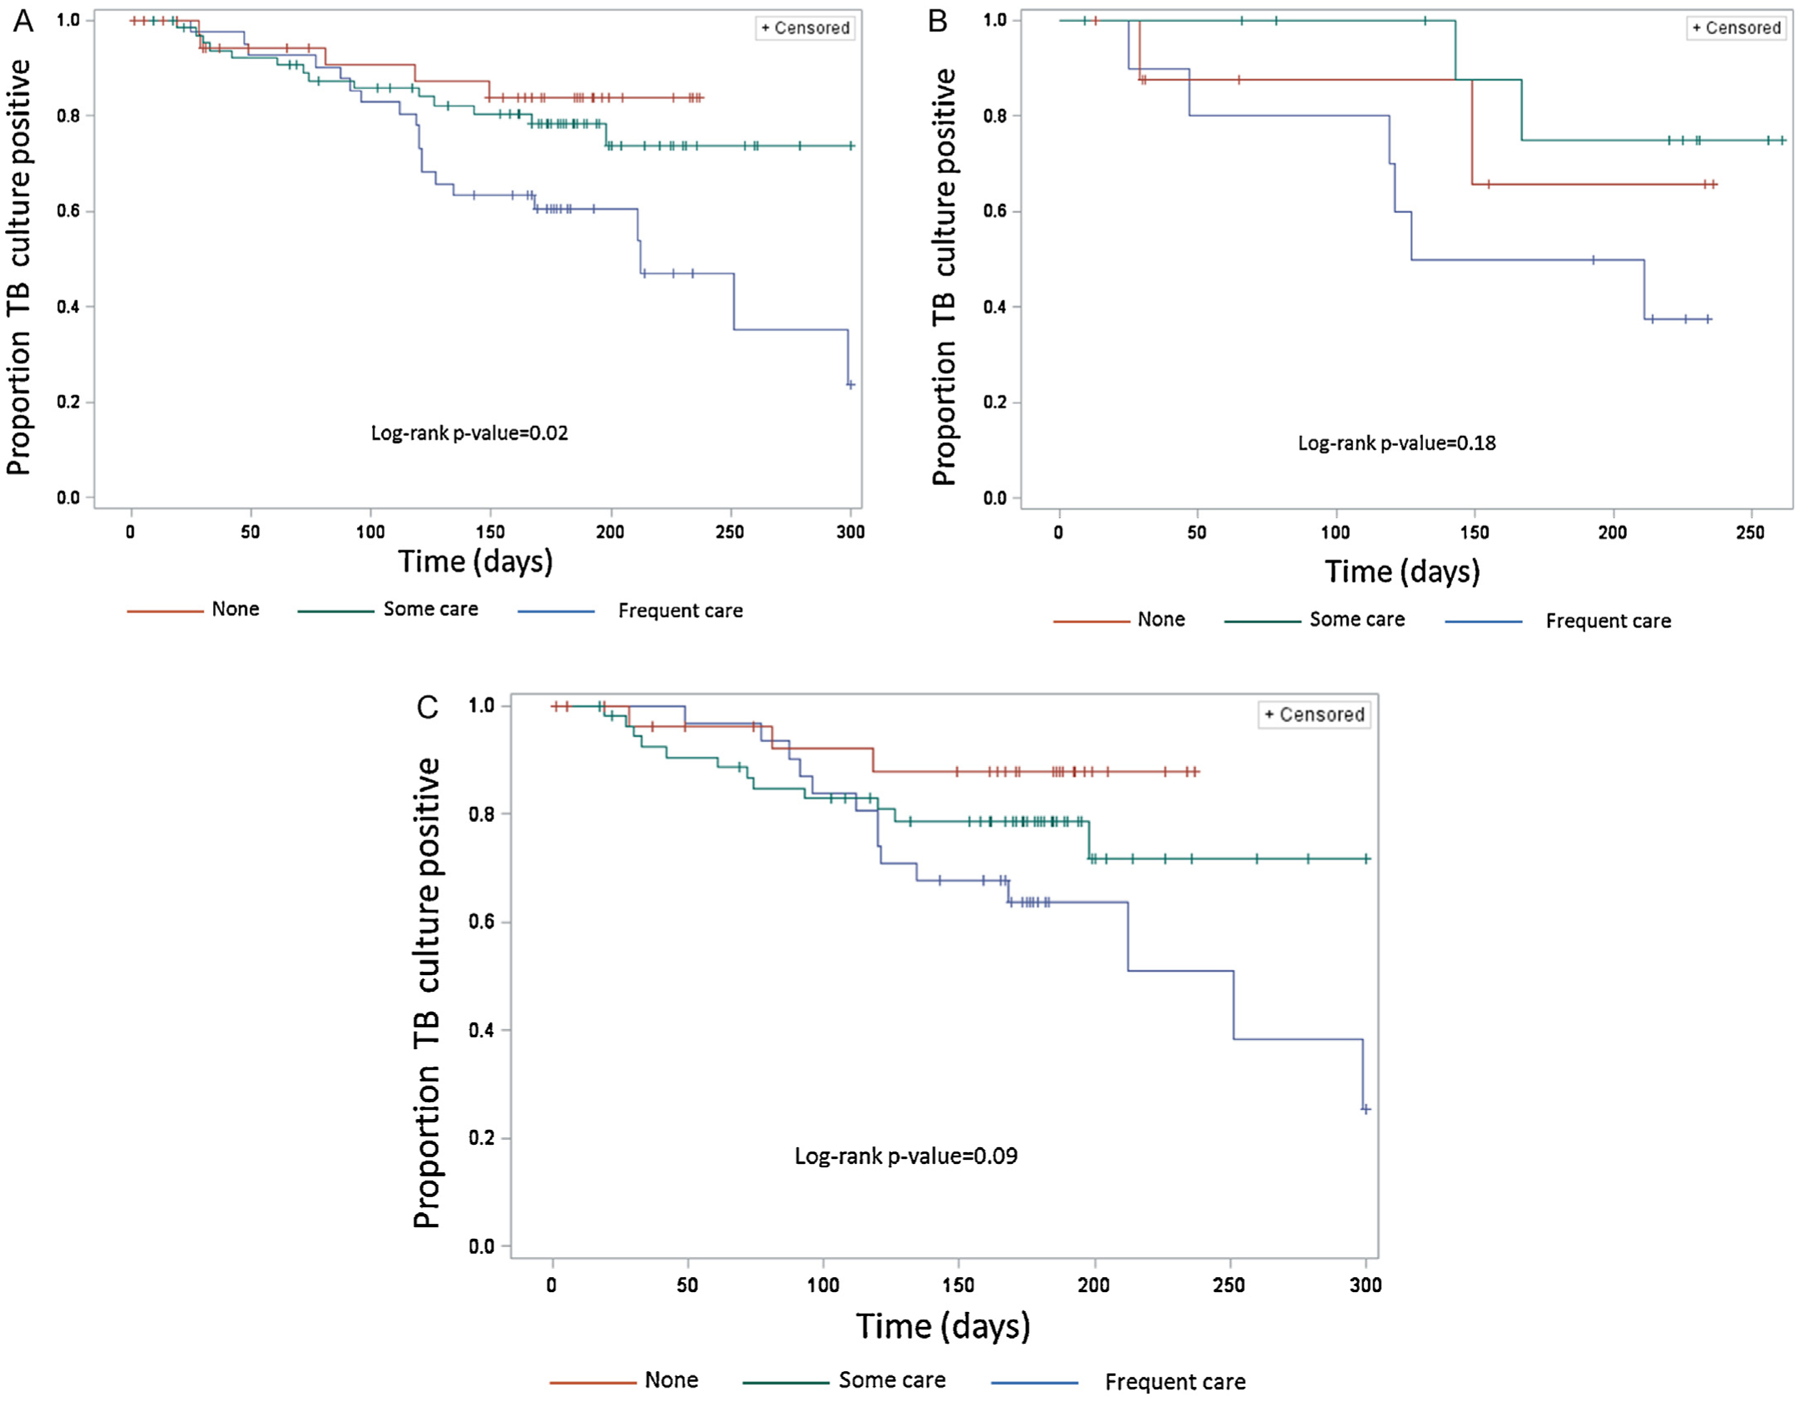
Figure 4.

(A) Kaplan–Meier curves for time until tuberculosis (TB) culture conversion from positive to negative by diabetes care during TB treatment among TB patients with diabetes mellitus (n = 149). Frequent diabetes care during TB treatment was defined as at least three of the four following measures: at least one endocrinologist visit, medical record mentioned diabetes is controlled, recorded oral hypoglycemic agent or insulin use, or ≥3 documented blood glucose exams. Some care during TB treatment was defined as one or two of the aforementioned measures and none was defined as 0 of these measures. (B) Kaplan–Meier curves for time until TB culture conversion from positive to negative by diabetes care during TB treatment among TB patients with diabetes mellitus who have been previously treated for TB (n = 32). (C) Kaplan–Meier curves for time until TB culture conversion from positive to negative by diabetes care during TB treatment among patients with diabetes mellitus who have not been previously treated for TB (n = 117).
