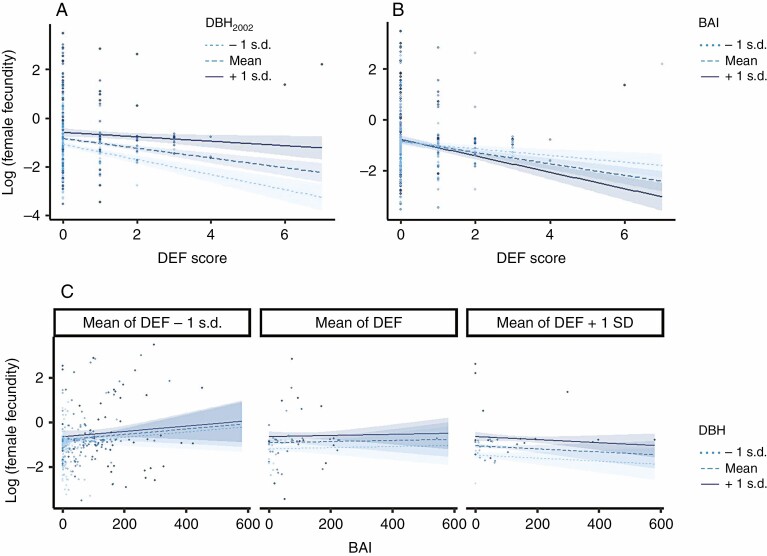
Fig. 3.
Interaction plots for (A) DEF and DBH2002 effects on female fecundity, (B) DEF and BAI effects on female fecundity, and (C) BAI, DBH2002 and DEF effects on female fecundity. Regression lines are plotted for three values of each moderator variable, corresponding to ±1 s.d. from the mean. Confidence interval at 80 % are shown around each regression line. Points are the observations.

