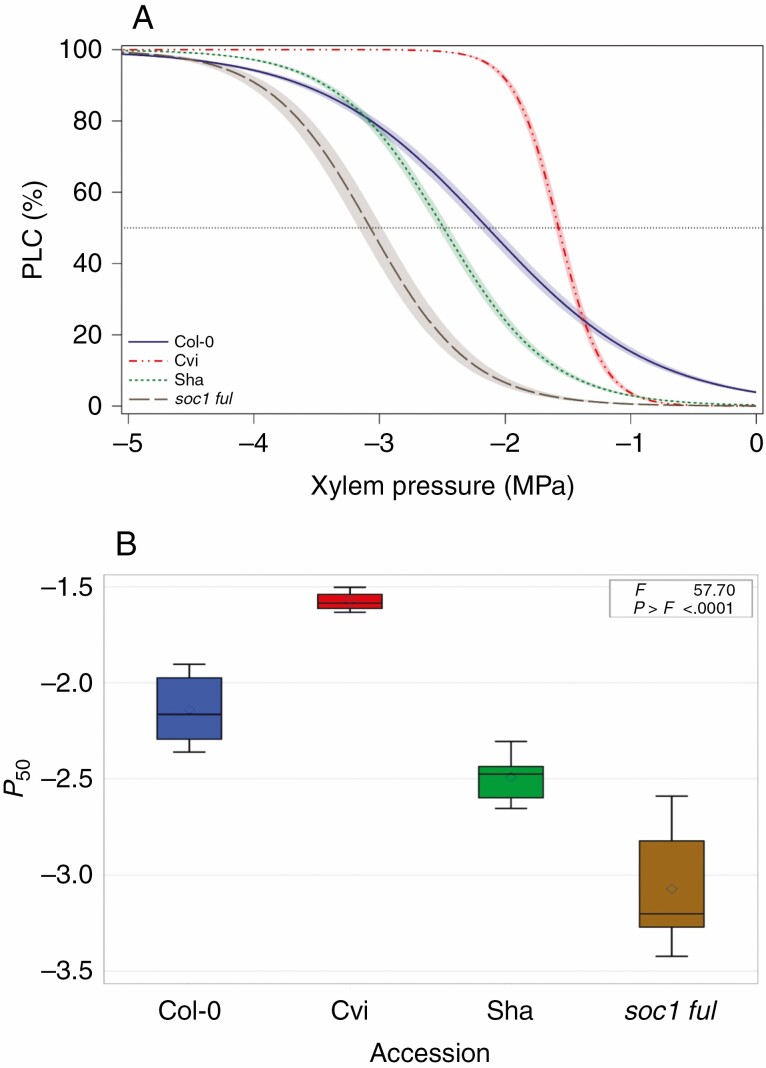
Fig. 1.
Stem P50 is significantly different across A. thaliana accessions. (A) Mean vulnerability curves for each accession presents the percentage loss of conductivity (PLC) as a function of xylem pressure (MPa). The dotted line shows 50 % loss of conductivity (P50). Shaded bands represent standard errors based on about ten vulnerability curves per accession. (B) Boxplot showing P50 distribution and variation within and between accessions (P = 0.05).

