Figure 7.

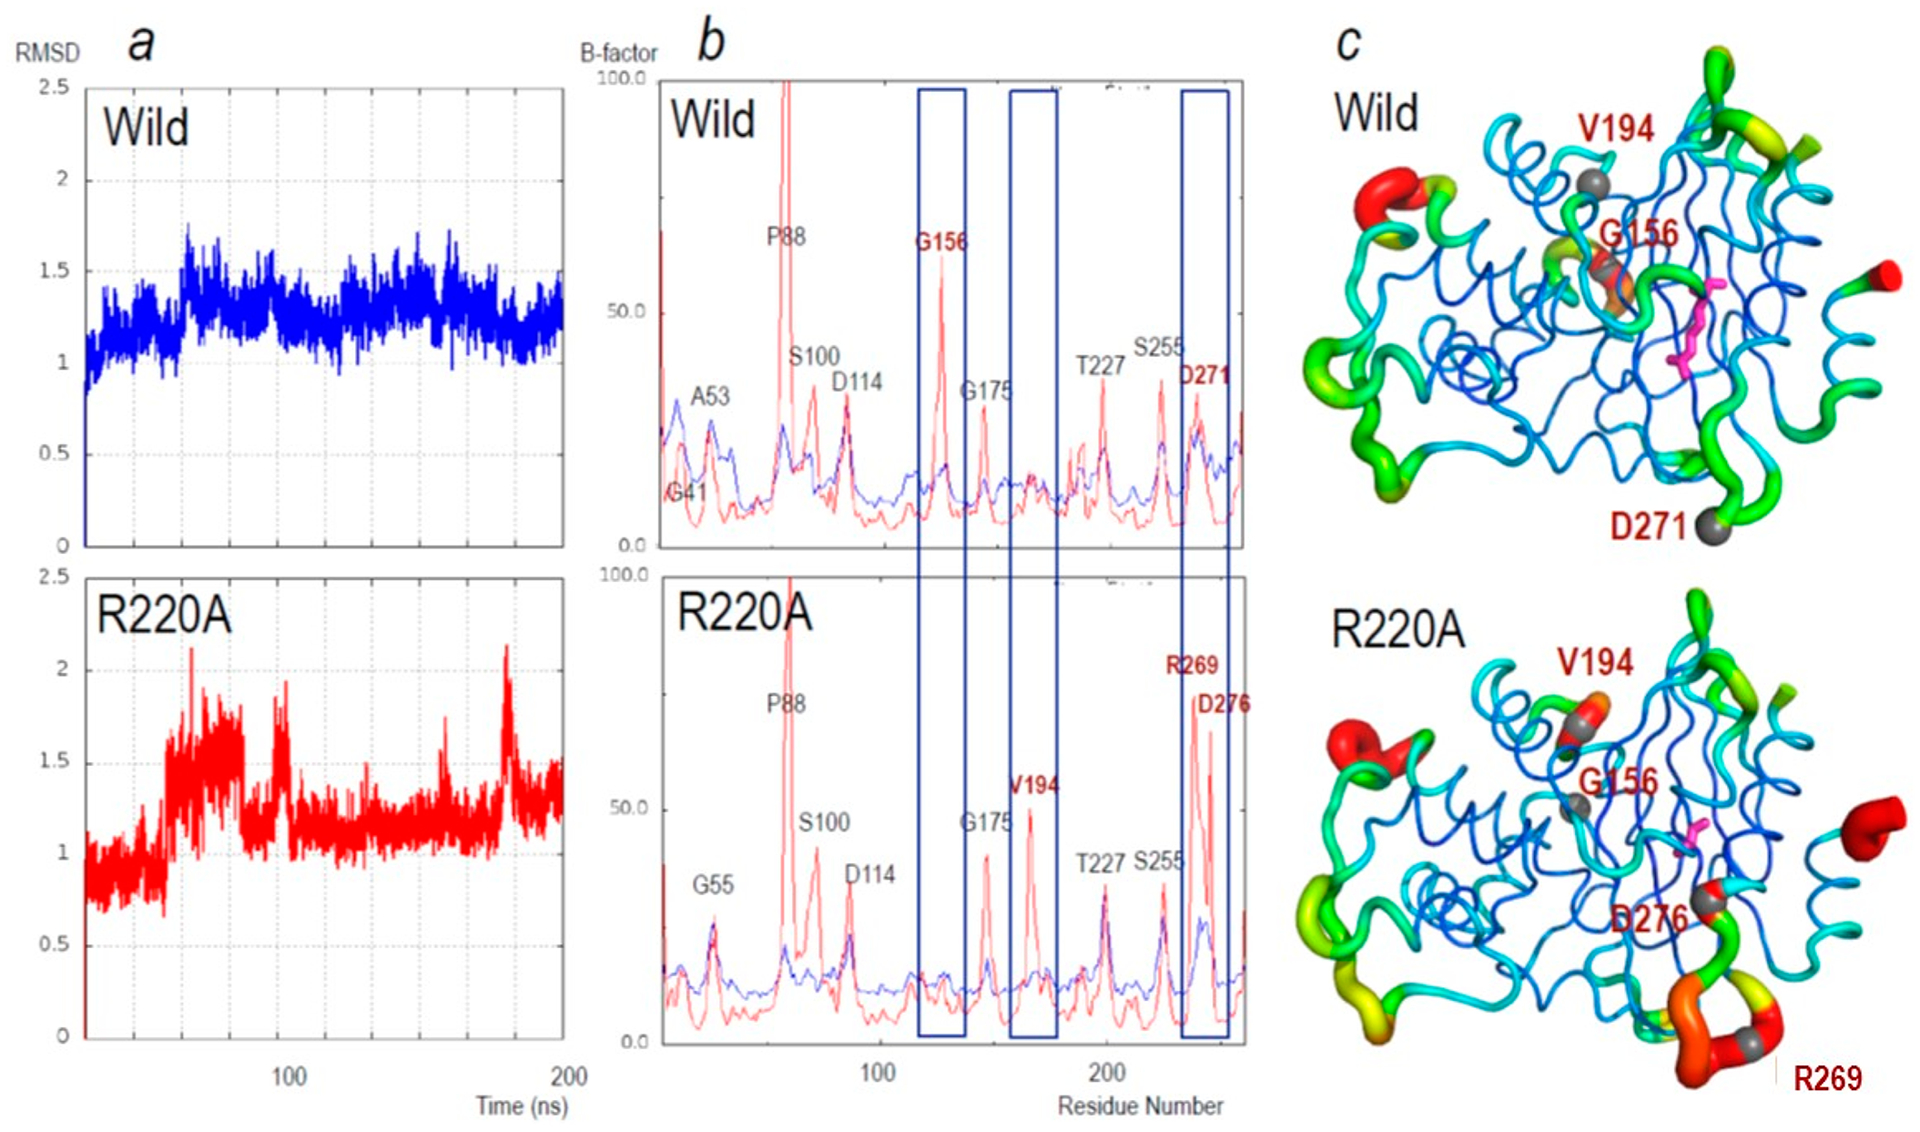
(a) Changes in the root-mean-square deviation (RMSD) for main-chain atoms during the 200 ns simulations relative to the starting structure. Upper, PenA1 (wild, blue lines) and lower, R220A (R220A, red lines). (b) Average B-factors of main-chain atoms of the individual amino acid residues during the 200 ns MD simulations (red); the average B-factors of the crystal structure (blue). Upper: PenA1 (Wild) and Lower: R220A (R220A). Labels on the peak indicate the residue using standard class A β-lactamase numbering. Residues with the largest changes in B-factor are in red font and highlighted by blue rectangles. (c) B-factors from MD simulation putty representation on Pymol of (upper) PenA1 and (lower) R220A. The color changes from blue (B-factors below 5.0), while cyan, green, yellow, and red (B factors of more than 50.0). The thickness of the lines reflects the height of the B-factor. The stick model (magenta) indicates the position of R220 and A220, respectively. Sphere atom models and red font indicate the peak position found in panel (b).
