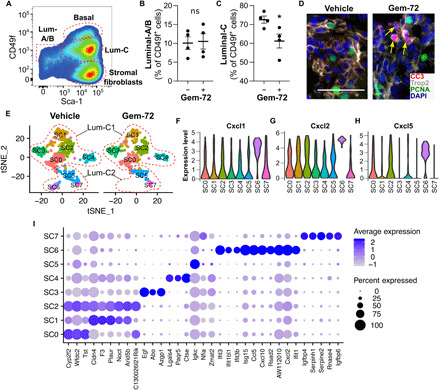
Fig. 3. Effect of Gemini-72 on luminal-C subsets.

(A) Representative pseudocolor plot of the cell populations identified by FACS in vehicle-treated Pten(i)pe−/− mice (A) and quantification of luminal-A/B (B) and luminal-C (C) in Pten(i)pe−/− mice treated for 1 week with vehicle and Gemini-72. Comparisons between vehicle- and Gemini-72–treated mice were performed using Student’s t test. Error bars ± SEM; n = 4 mice per condition. *P < 0.05; ns, P ≥ 0.05. (D) Representative Trop2 (gray), cleaved caspase 3 (CC3; red), PCNA (green) immunostainings, and DAPI (blue) in prostate sections of Pten(i)pe−/− mice treated for 3 weeks with vehicle or Gemini-72. Representative images of the DL lobes are shown. n = 3 mice per condition. Scale bars, 50 μm. (E) t-SNE plot of luminal-C subclusters of a Pten(i)pe−/− mouse treated for 1 week with vehicle or Gemini-72. Violin plots showing the expression of Cxcl1 (F), Cxcl2 (G), and Cxcl5 (H) in luminal-C subclusters of a vehicle-treated Pten(i)pe−/− mouse. (I) Dot plot of subcluster-specific marker expression.
