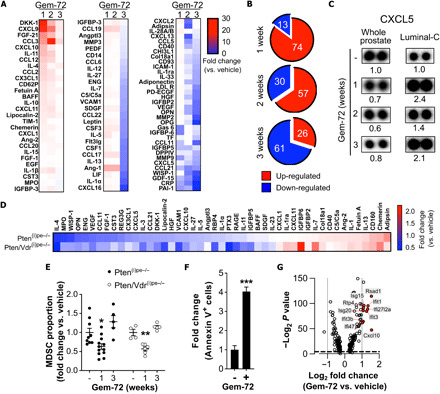
Fig. 5. Effects of Gemini-72 on MDSCs in Pten(i)pe−/− prostates.

(A) Heat map of cytokine levels in whole prostates of Pten(i)pe−/− mice treated with Gemini-72 for 1, 2, and 3 weeks. Lysates of three prostates per condition were pooled. (B) Pie charts depicting the number of up- and down-regulated cytokines in whole prostates after 1, 2, and 3 weeks of Gemini-72 treatment. (C) CXCL5 levels on cytokine array membranes of whole prostates and of luminal-C cells of Pten(i)pe−/− mice after vehicle or 1, 2, and 3 weeks of Gemini-72 treatment. Lysates of three whole prostates per condition were pooled, and FACS-sorted luminal-C cells were obtained from a pool of three prostates. (D) Heat map of cytokine levels regulated by a 3-week Gemini-72 treatment in lysates of FACS-sorted stromal fibroblasts of Pten(i)pe−/− and Pten/Vdr(i)pe−/− prostates. Lysates were obtained from a pool of three prostates per condition. (E) FACS analysis of the proportion of MDSCs (CD11b+Gr-1+) in prostates of Pten(i)pe−/− and Pten/Vdr(i)pe−/− mice in response to Gemini-72 treatment. n = 4 to 12 mice per condition; error bars ± SEM. Comparisons between the different conditions were performed using one-way ANOVA followed by a post hoc Tukey test. *P < 0.05 and **P < 0.01, compared to vehicle-treated mice. (F) Quantification of annexin V+ leukocytes (CD45+) in prostates of Pten(i)pe−/− mice treated for 1 week with vehicle or Gemini-72. n = 3 mice per condition. Data were compared using Student’s t test. ***P < 0.001. (G) Volcano plot depicting the genes significantly modulated by Gemini-72 in MDSC-A (cluster 11). Interferon signaling–related genes are highlighted in red.
