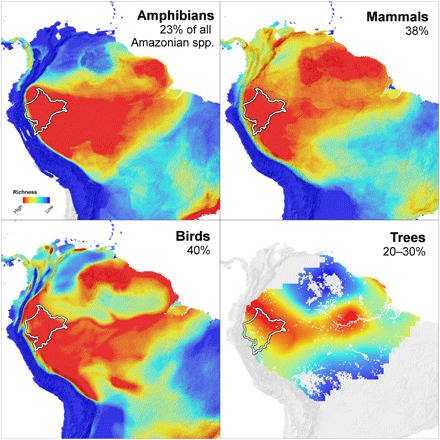
Fig. 1. Maps illustrating the distribution of species richness of four taxonomic groups across South America from highest (red) to lowest (blue).

The white border outlines Peru’s Loreto region, which accounts for 5% of the Amazon basin’s area. Percentages in each panel indicate the proportion of all Amazonian species expected to occur in Loreto. For amphibians, mammals, and birds, maps and percentages were based on (4); the tree map was based on (5), and the tree percentage is an estimate based on (3, 6).
