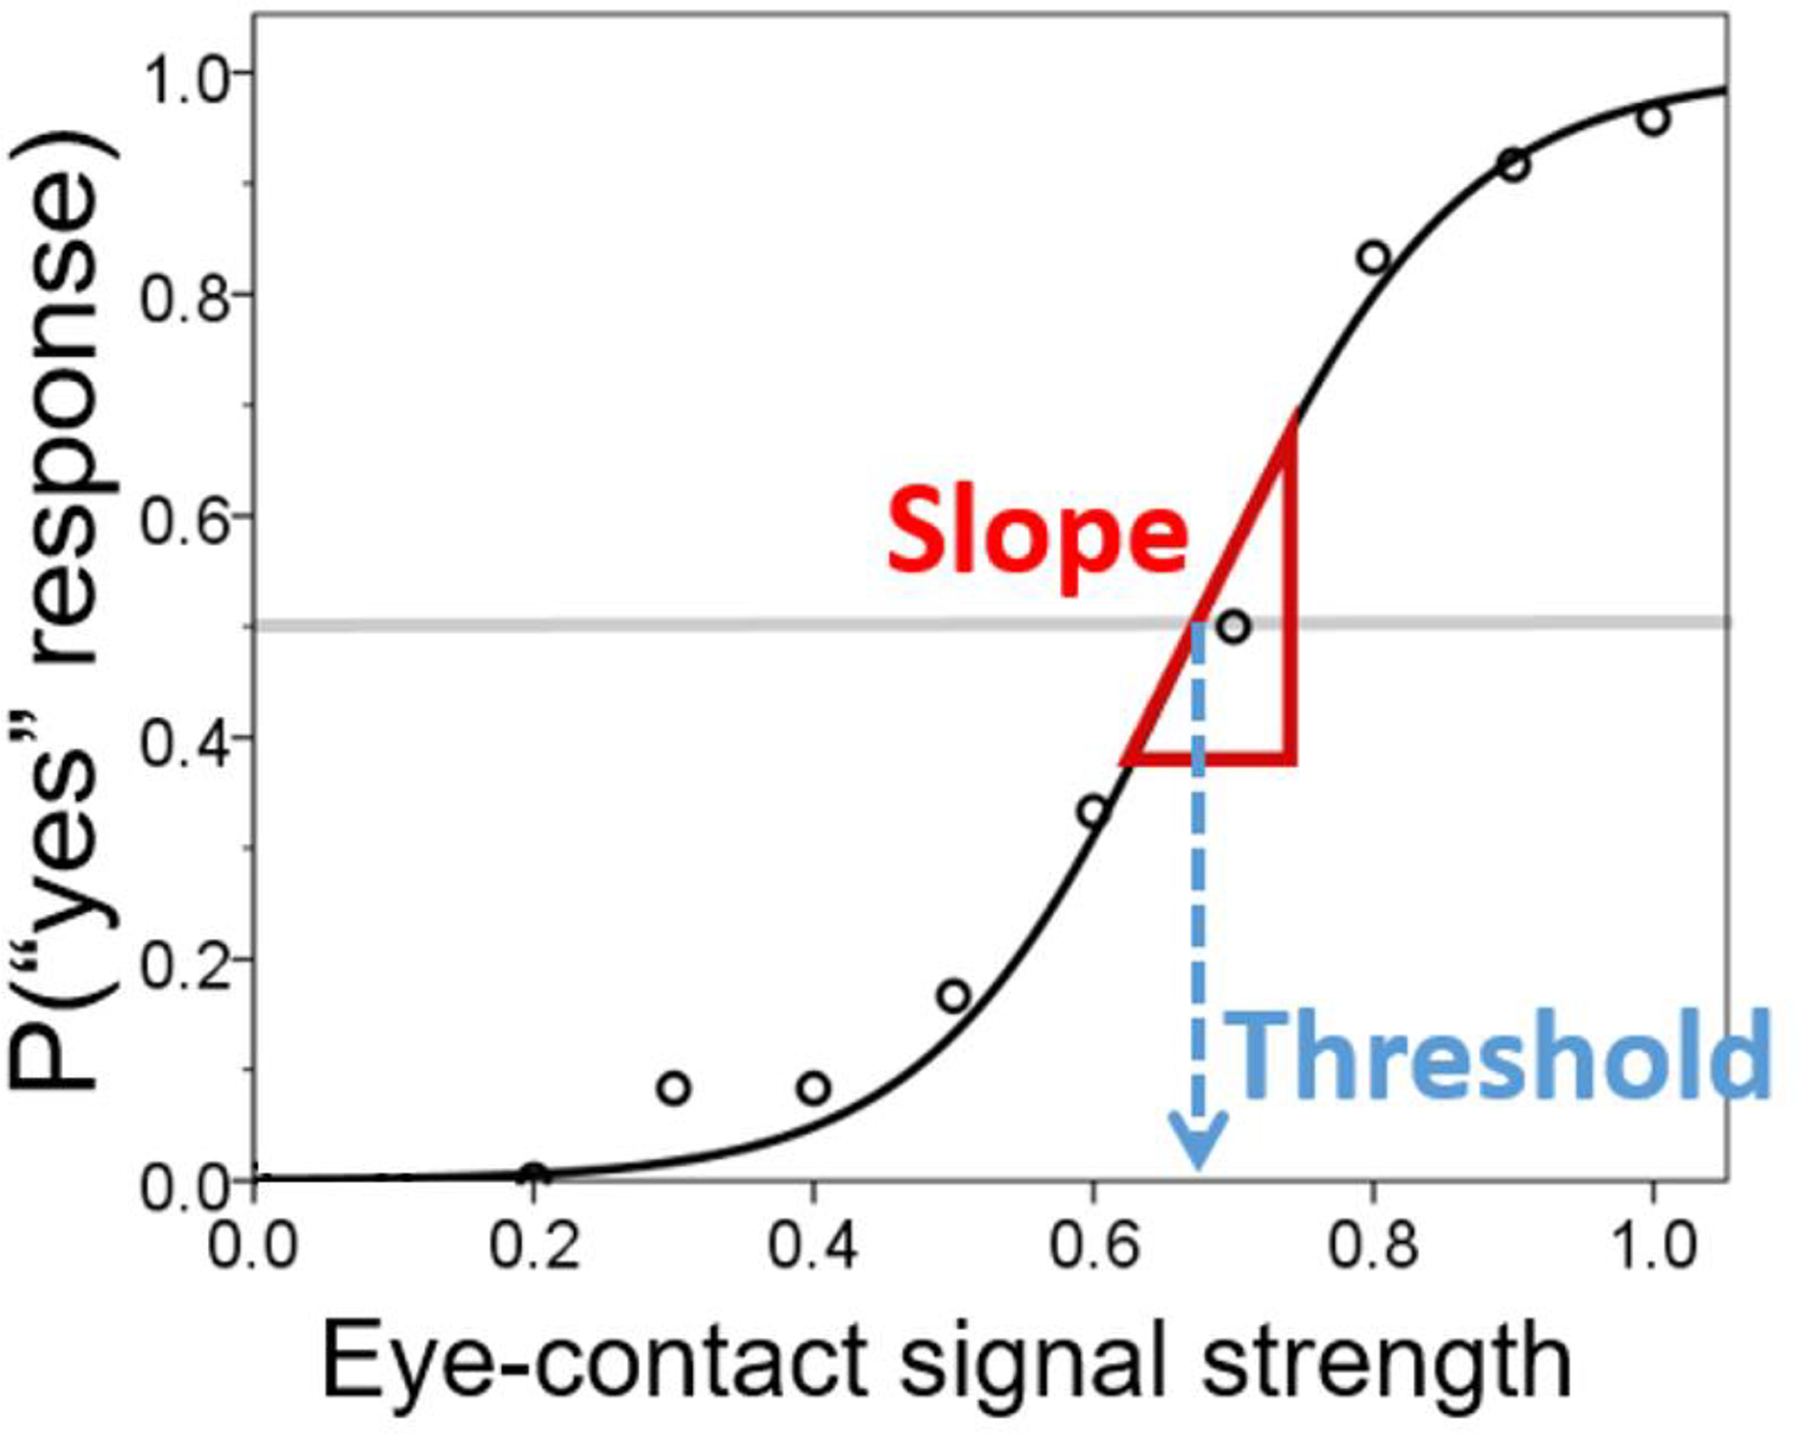
Figure 2.

The psychophysical approach to derive gaze perception metrics. Probability of perception of self-directed gaze (“yes” response) is conceptualized as a function of eye-contact signal strength. The curve represents a theoretical, logistic function generative of the data (proportion of number of trials in which self-directed gaze was endorsed out of the total number of trials completed; represented by round markers). The slope of the curve at y = 0.5 indicates one’s perceptual precision (i.e., how sensitive the perception is with respect to change in eye-contact signal strength). The threshold (x value at y = 0.5) represents the intensity of eye-contact signal that elicits eye-contact perception 50% of the time; lower thresholds indicate that weaker signals are needed to perceive gaze as self-directed, thus representing a stronger self-referential bias.
