
Fig. 1: Controlled diet study of the effects of fibre snack food prototypes on the faecal microbiomes of overweight and obese humans.
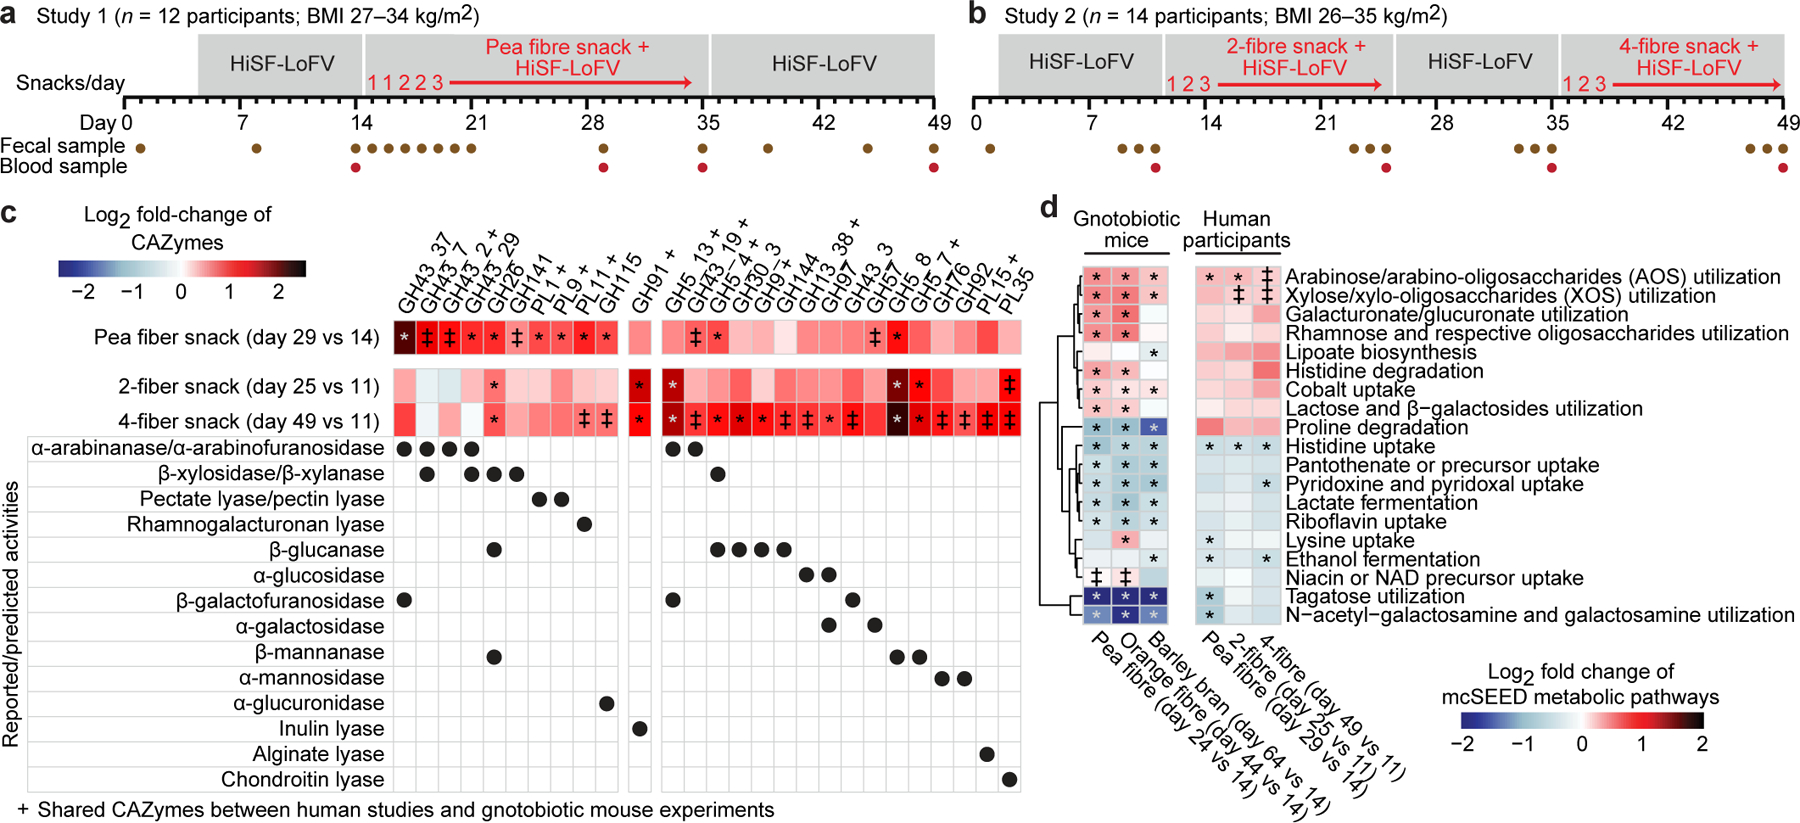
a,b, Study designs. c, Heatmap plotting discriminatory CAZymes for all three fibre snack treatments whose log2-fold change in abundance was statistically significant during at least one dietary intervention in the faecal microbiomes of participants during consumption of either of the fibre snacks relative to last day of the pretreatment phase. Data are averaged for all participants during each dietary intervention period (n=12 and 14 participants for study 1 and 2, respectively, n=66 faecal samples analysed). d, Heatmap of discriminatory mcSEED pathways represented in the microbiomes of gnotobiotic mice and human participants whose changes in abundance were statistically significant during at least one of the dietary fibre interventions. The heatmap depicted on the left shows the grand mean of the log2 fold-change in abundances of mcSEED pathways in animals containing the nine different human donor communities (n=6 to 10 mice/donor microbiome; n=232 faecal samples analysed), while the heatmap on the right shows the mean log2 fold-change in the abundances of mcSEED pathways in participants consuming the pea fibre, 2-fibre or 4-fibre snacks (n=12 and 14 for studies 1 and 2, respectively; n=66 faecal samples analysed). The order of mcSEED pathways from top to bottom is based on hierarchical clustering (Euclidean distances). ‡ q-value <0.1, * q-value <0.05 (linear-mixed effects model, FDR-corrected). CAZymes marked with a ‘+’ were also fibre-treatment discriminatory in the gnotobiotic mouse studies.