
Extended Data Fig.12: Plasma proteins with statistically significant changes in their abundances as a function of fibre treatment type and participant.
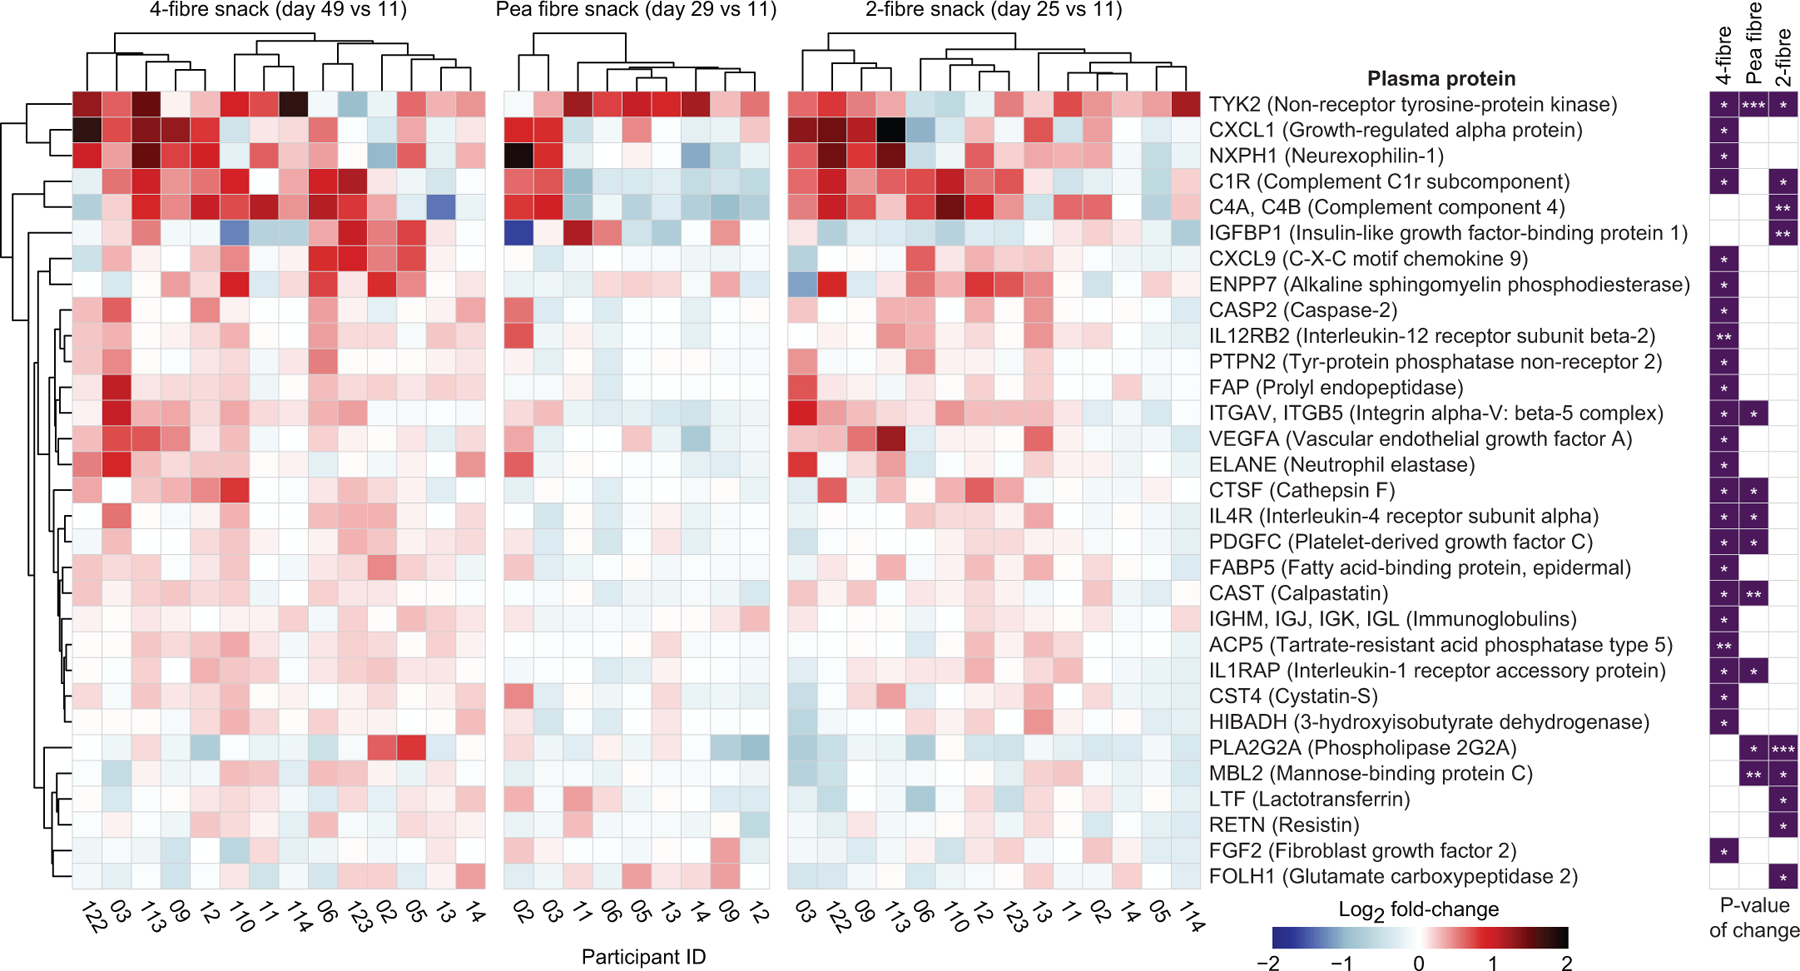
Heatmap plotting the log2 fold-change in the abundances of plasma proteins in participants consuming the indicated fibre snack prototype. Data from the nine participants in study 1 (pea fibre snack) who were also enrolled in study 2 (2- and 4-fibre snacks) are shown. Changes in protein levels are referenced to their abundances on the last day of the pretreatment phase (day 14 and day 11 in study 1 and study 2, respectively) (n=66 blood plasma samples analysed). *, P<0.05; ** P<0.01; *** P<0.001 (linear model, limma25).