
Extended Data Fig. 2: The effects of dietary fibres in gnotobiotic mice colonized with nine different obese human donor microbiota and fed a HiSF-LoFV diet.
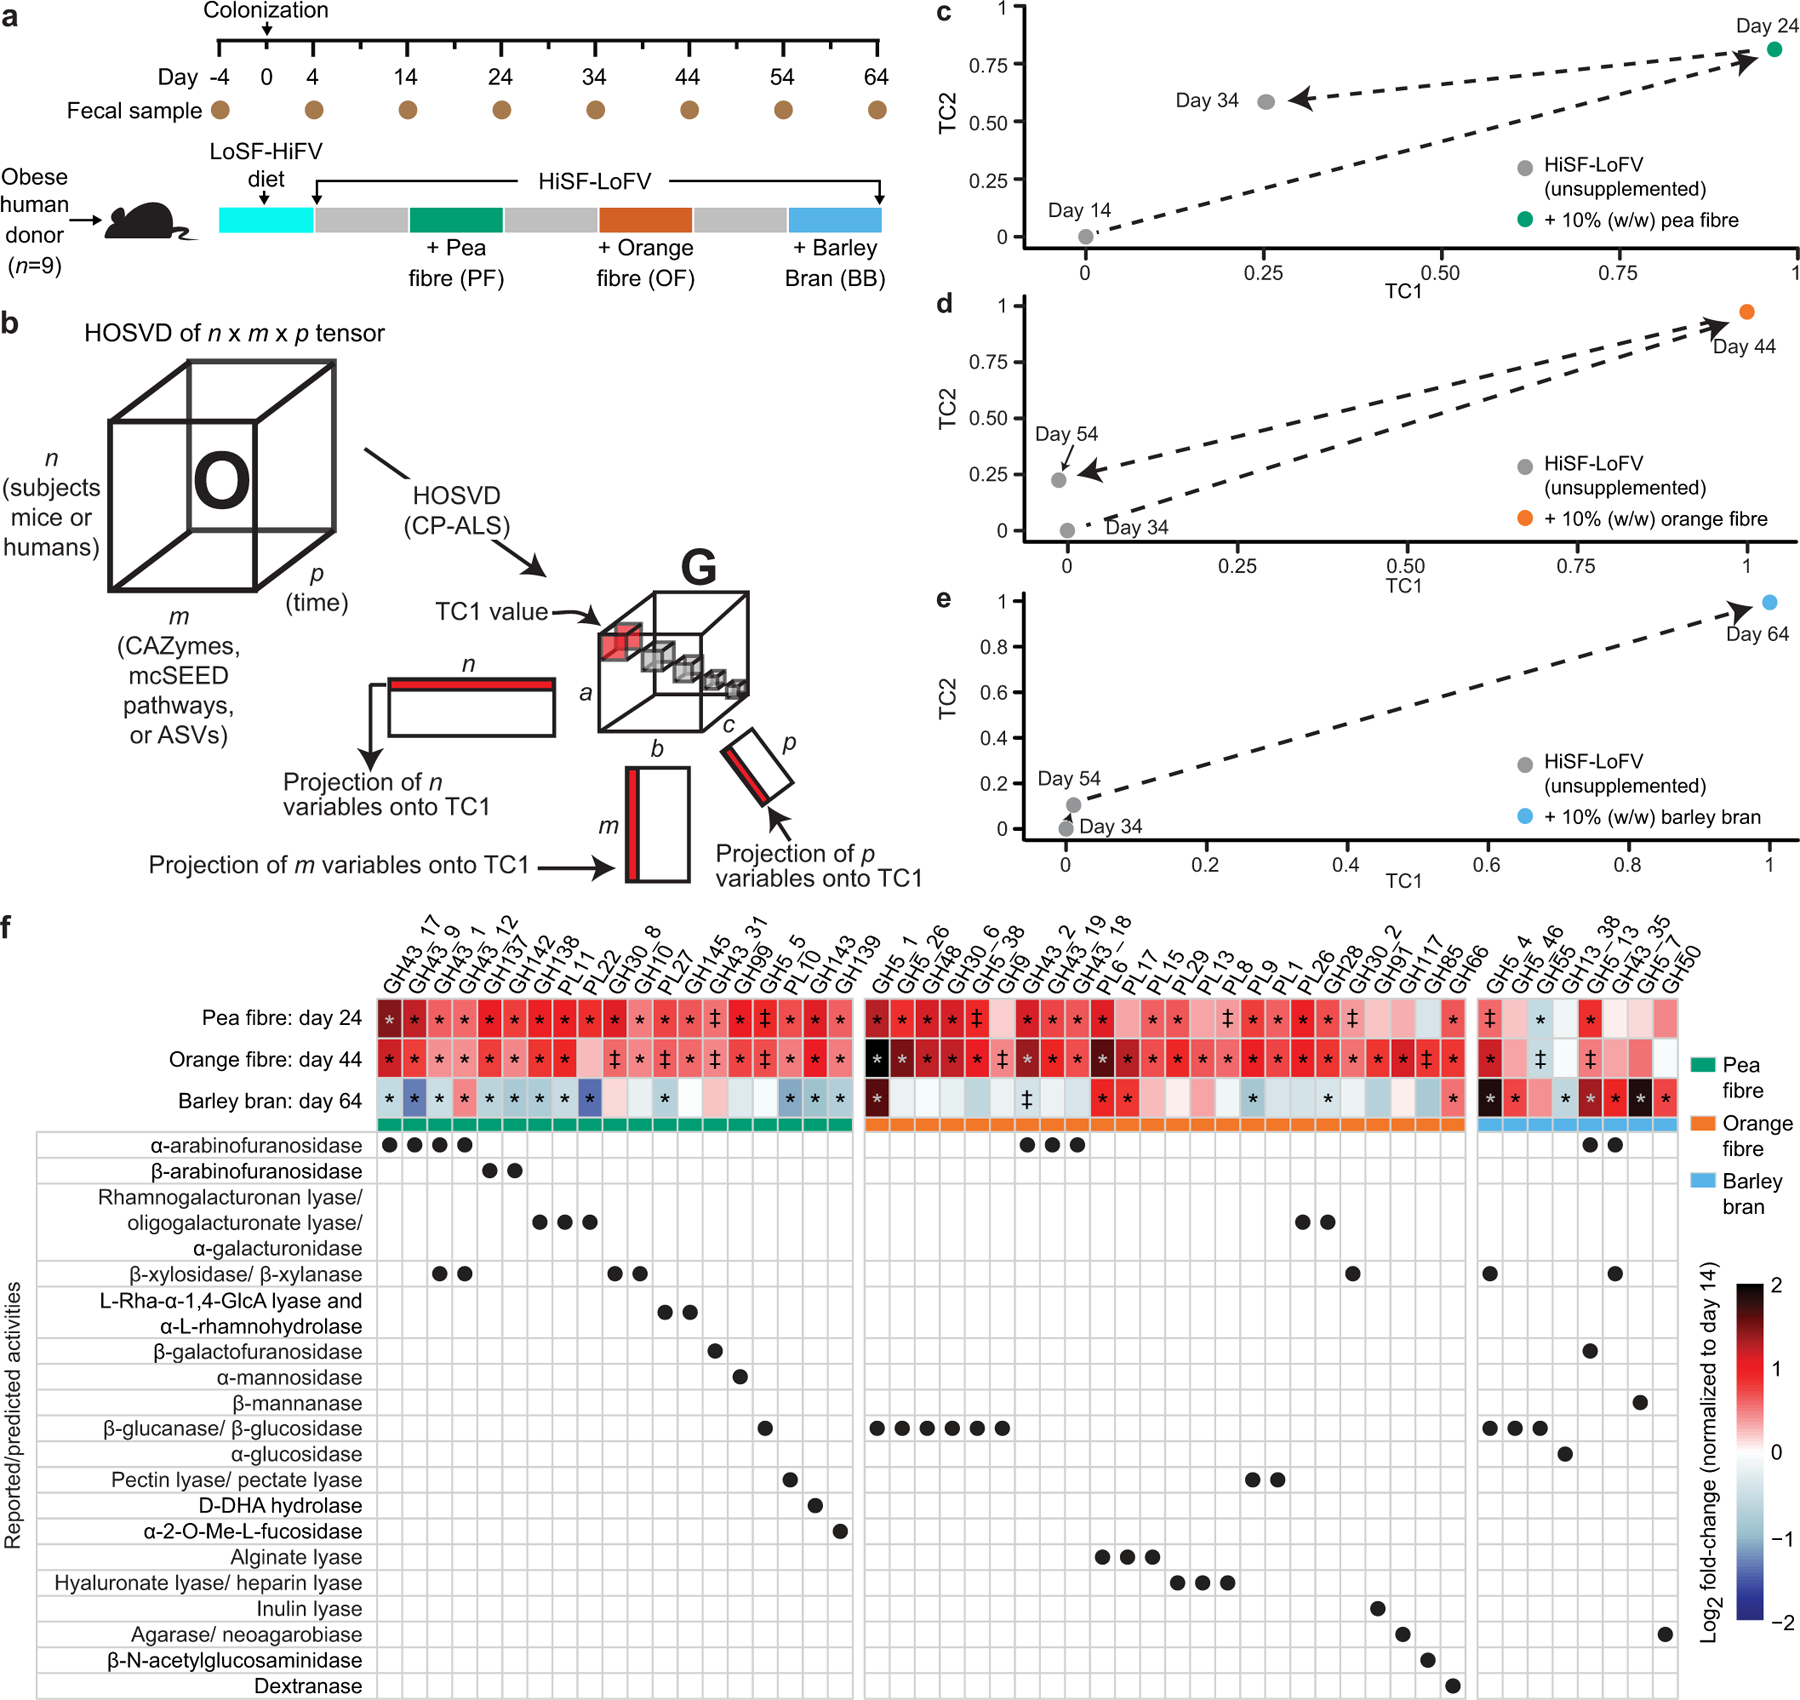
a, Experimental design. b, Higher-Order Singular Value Decomposition (HOSVD). Three-dimensional matrices are termed ‘tensors’. A tensor O with dimensions n, m, and p, where n represent subjects (mice or humans), m represents features (ASVs, CAZymes, mcSEED pathways), and p represents time, can be analysed by HOSVD where a ‘core tensor’ (G) is created—a tensor where the only non-zero values are along the diagonal (boxes shown in G). Each box represents a ‘tensor component’ (TC). Each TC relates the variation between each axis of the O tensor. Additionally, three new matrices are created that are related to each other through each TC; e.g., ‘Projection of variables onto TC1’ indicates that variation defined by TC1 is defined by variation across the first row of n, the first column of m, and the first column of p. c-e, HOSVD applied to CAZymes in faecal microbiomes of mice colonized with nine different obese human donor microbial communities (n=348 faecal samples analysed) during each of the three dietary fibre interventions in the diet oscillation experiment. f, Heatmap of discriminatory CAZymes whose log2 fold-changes in abundances were defined as statistically significant during at least one dietary intervention. The grand mean of the data is shown for animals containing the nine different human donor microbiomes sampled at the indicated time points and normalized to day 14 values (n=6–10 mice/group; n=232 faecal samples analysed). The order of CAZymes from left to right is based on their function (rows below) and magnitude of their change within and across fibre treatments. ‡, q-value < 0.10; *, q-value < 0.05 (linear-mixed effects model, FDR-corrected).