
Extended Data Fig.3: Responses of CAZymes and mcSEED metabolic pathways identified by HOSVD analysis as discriminatory for fibre snack consumption in gnotobiotic mice colonized with the nine different human donor faecal communities.
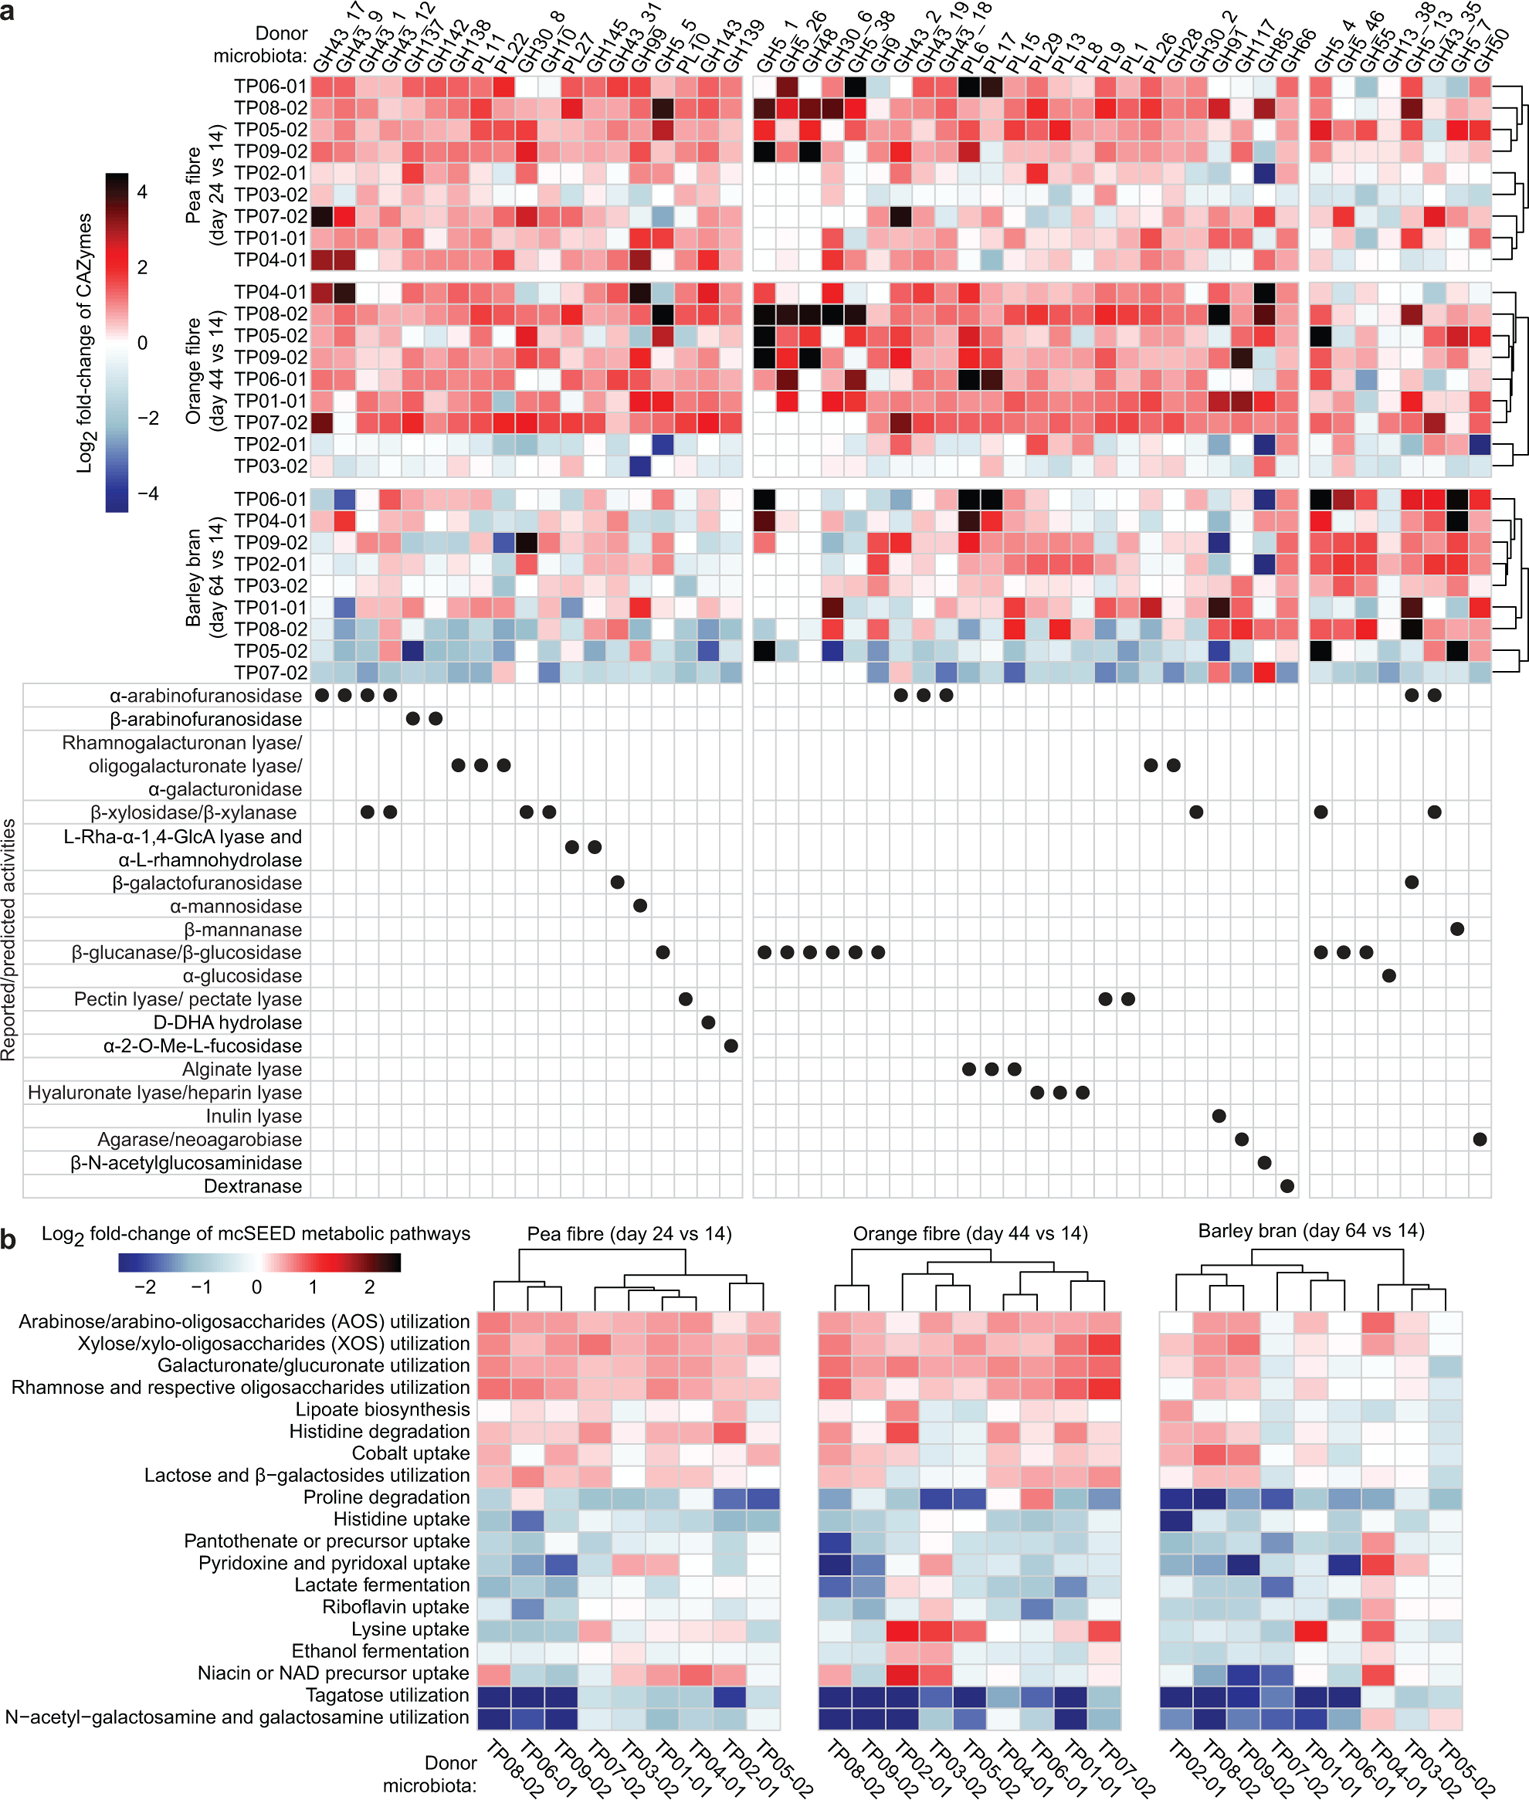
a,b, Heatmap of discriminatory CAZymes and mcSEED metabolic pathways whose changes in abundance were statistically significant during at least one dietary intervention. Data are averaged for animals containing a given human donor microbiota (n=6 to 10 mice/group; n=232 faecal samples analysed) sampled at the indicated time points and normalized to day 14 values. Note that the order of CAZymes from left to right of the heatmap in panel a follows the same order as in Extended Data Fig. 2f, while the order of mcSEED pathways from top to bottom in panel b follows the same order as shown in Fig. 1d. Hierarchical clustering (Euclidean distances) of CAZyme and mcSEED metabolic pathway profiles was used to group donor microbiomes.