
Extended Data Fig.5: Responses of bacterial taxa (ASVs) identified by HOSVD as discriminatory for dietary fibre consumption in gnotobiotic mice colonized with human donor microbiota, and in human participants enrolled in the controlled diet studies.
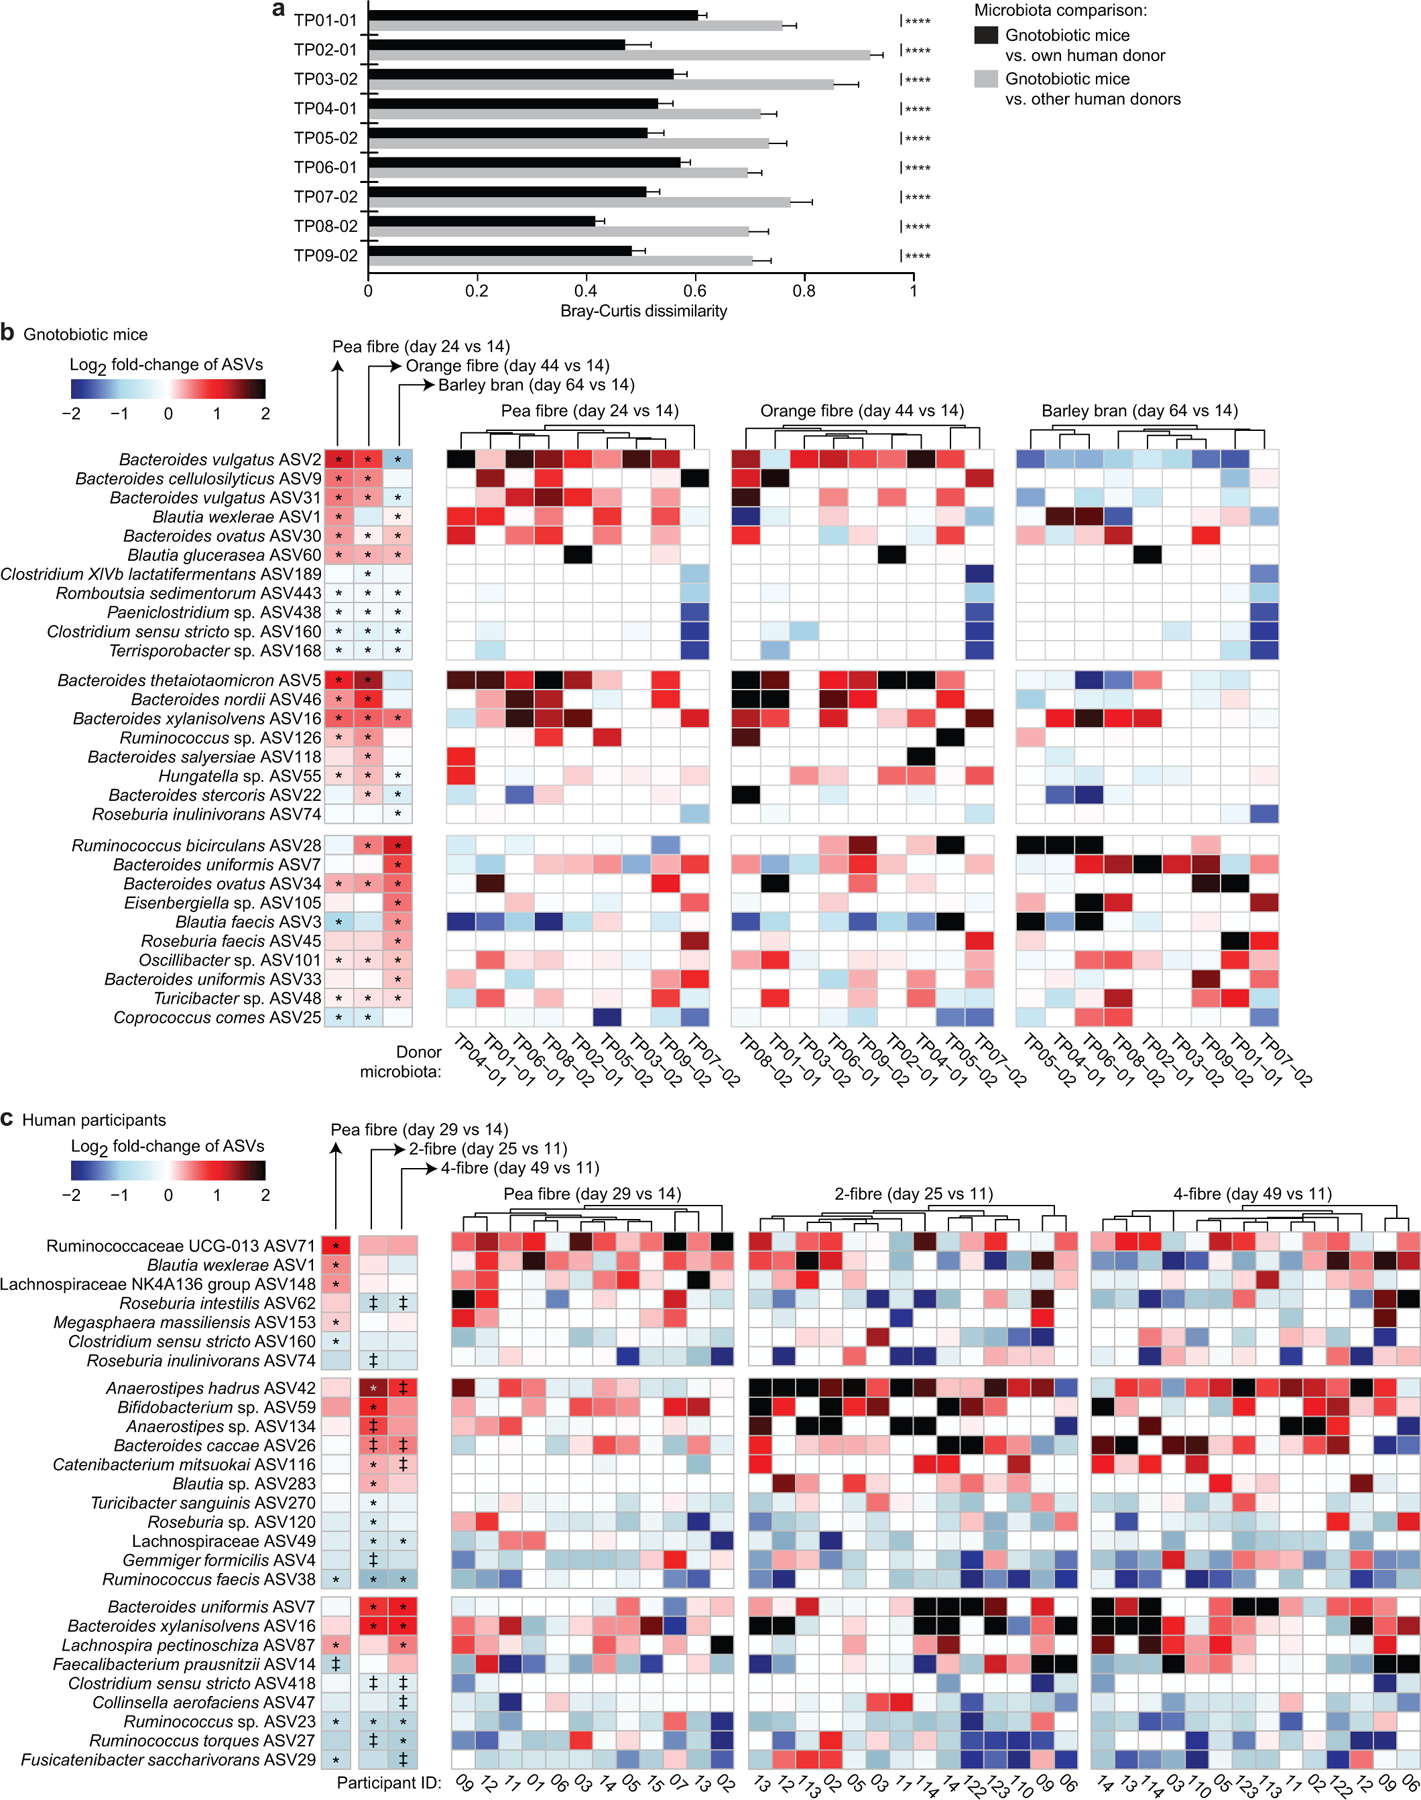
a, Bray-Curtis dissimilarity distances calculated from the ASV content of communities sampled at all time points (days 4, 9, 14, 19, 24, 29, 34, 39, 44, 49, 54, 59, and 64 post-colonization) from a given group of recipient mice compared to the ASV content of their corresponding human donor community prior to transplantation (Bray-Curtis distances calculated from ASV abundances in faecal samples collected from each group of mice (n=6–10 animals; n=752 faecal samples in total) compared to the abundances of these ASVs in each of their corresponding nine human donor faecal communities). ****, P-value <0.0001 (one-way ANOVA, Šídák’s correction). b, Heatmap of statistically significant log2 fold-changes in the abundances of discriminatory ASVs in gnotobiotic mice during at least one of the fibre interventions. The heatmap on the left shows the grand mean for data obtained from all groups of animals while the heatmap on the right shows averaged data for animals containing a given donor microbiota (n=6 to 10 mice/group; n=232 faecal samples obtained at the indicated time points with data normalized to day 14 values). Hierarchical clustering (Euclidean distances) of ASV profiles was used to group donor microbiota with similar responses to each fibre supplement. c, ASVs whose log2 fold changes in abundance were statistically significant in human participants after at least one of the fibre snack interventions. The left panel shows mean values for participants enrolled in each study, while the three panels to the right show changes in ASV abundances in individual participants after consumption of each of the fibre snacks. Data are normalized to pre-treatment timepoints, i.e., day 14 (study 1) and day 11 (study 2) (n=12 and 14 participants for study 1 and 2, respectively, n=66 faecal samples analysed). Hierarchical clustering (Euclidean distances) of ASV profiles was used to group participants with similar responses to a given fibre snack. ‡ q-value < 0.1, * q-value < 0.05 (linear-mixed effects model, FDR-corrected).