
Extended Data Fig.8: Schematic of the analytic pipeline for identifying associations between changes in the plasma proteome and CAZyme responses after fibre snack consumption.
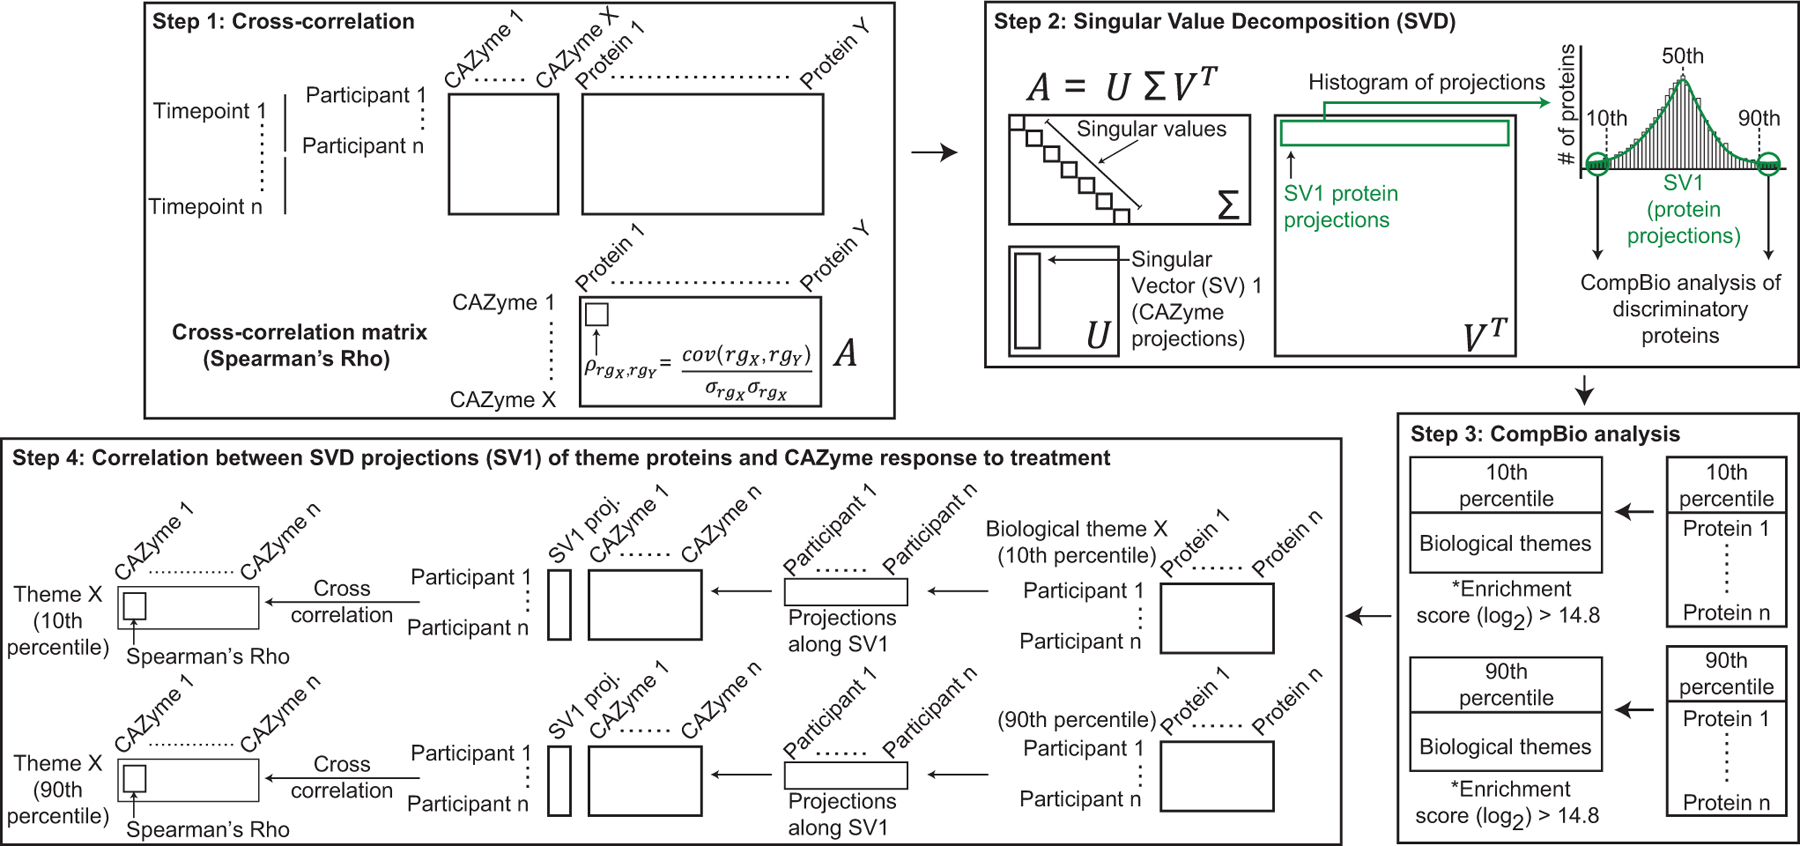
Step 1 shows cross-correlation analysis between plasma proteins and discriminatory CAZymes whose changes in abundance were statistically significant. Step 2 shows SVD analysis of Spearman’s Rho values of the cross-correlation matrix. Proteins with projections along Singular Vector (SV) 1 are plotted in a histogram to identify those proteins most correlated with discriminatory CAZymes (those within the 10th and 90th percentile, α<0.1). Step 3 represents a CompBio-based analysis of groups of proteins with SV1 projections within the 10th and 90th percentiles. Biological themes enriched in proteins binned in the 10th and 90th percentile are generated [threshold cutoff for enrichment score (log2) > 14.8]. Step 4 is an SVD analysis of protein profiles within each biological theme for all participants, followed by cross-correlation between SVD projections (SV1) of themed proteins and discriminatory CAZyme responses to treatment.