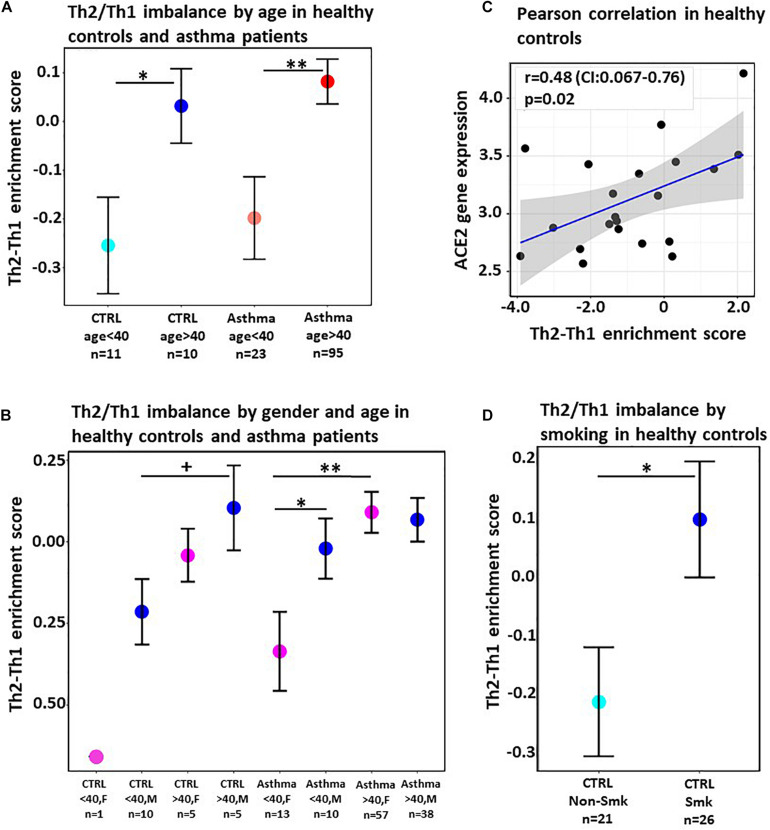
FIGURE 1.
(A) Mean difference in Th2 and Th1 enrichment scores in the sputum of healthy individuals (CTRL) and severe asthma patients stratified by age. Horizontal bars denote standard error. (B) Mean difference in Th2 and Th1 enrichment scores in sputum of healthy individuals (CTRL) and of asthma patients in both males (M) and females (F) stratified by age. Horizontal bars denote standard error. (C) Correlation scatterplot between Th2/Th1 enrichment score and ACE2 gene expression in healthy individuals. Gray shaded area denotes the 95% confidence interval. Pearson correlation coefficient and p-value are provided. (D) Mean difference in Th2 and Th1 enrichment scores in nasal epithelium of healthy smokers and healthy never smokers. Horizontal bars denote standard error. +p < 0.1, *p < 0.05, **p < 0.01.

