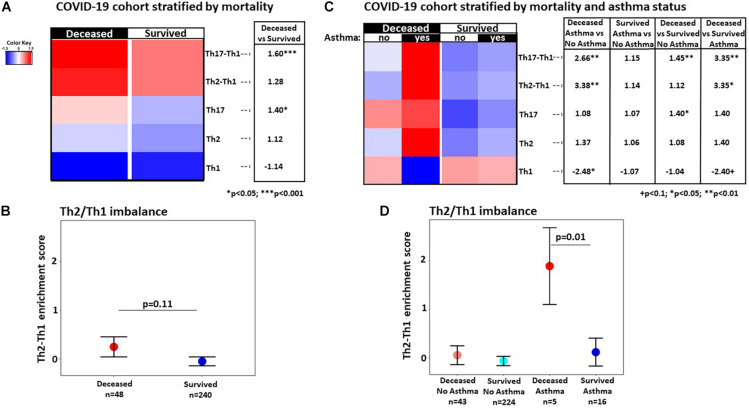
FIGURE 2.
(A) Heatmap of mean enrichment score by gene set variation analysis in all patients in the hospitalized COVID-19 cohort, stratified by subsequent mortality, with fold-change differences provided in the side table. (B) Mean difference in Th2 and Th1 enrichment scores in deceased versus survived patients. (C) Heatmap of mean enrichment scores by gene set variation analysis in asthma and non-asthma patients, stratified by mortality, with fold-changes provided in the side table. (D) Mean difference in Th2 and Th1 enrichment scores in deceased versus survived patients stratified by asthma status; means were estimated by a linear regression with age adjustment; +p < 0.1, *p < 0.05, **p < 0.01, ***p < 0.001.

