
Figure 2.
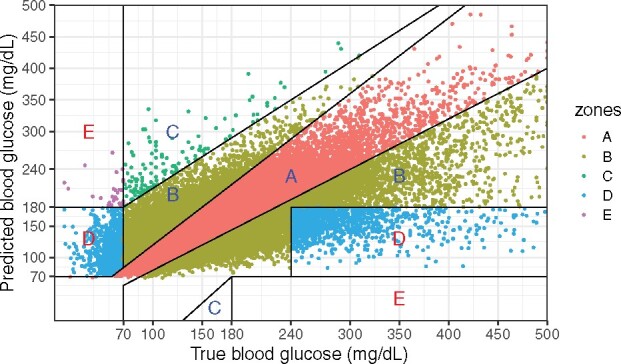
Clarke error grid analysis using forecast and observed blood glucose values from the test dataset. The percentage of points in each region are A: 71.4%; B: 25.6%; C: 0.2%; D:2.8; E:< 0.1, with the regions ranked (A–E) in terms of increasingly dangerous clinical consequences for the prediction error.