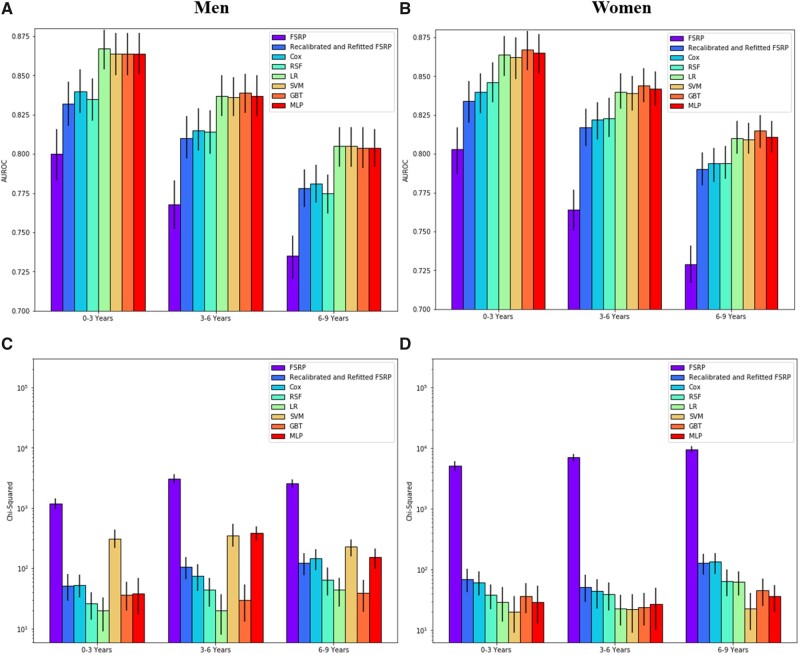
Figure 3.
Discrimination (subplots A and B) and calibration (subplots C and D) performance in men and women, respectively, for risk prediction of stroke at various time scales (0–3 years, 3–6 years, 6–9 years after baseline). Comparisons made between the 2017 Framingham Stroke Risk Profile (FSRP), a recalibrated and refitted FSRP, Cox, random survival forest (RSF), logistic regression (LR), support vector machine (SVM), gradient boosted tree (GBT), and multilayer perceptron (MLP) models.

