
FIG 3.
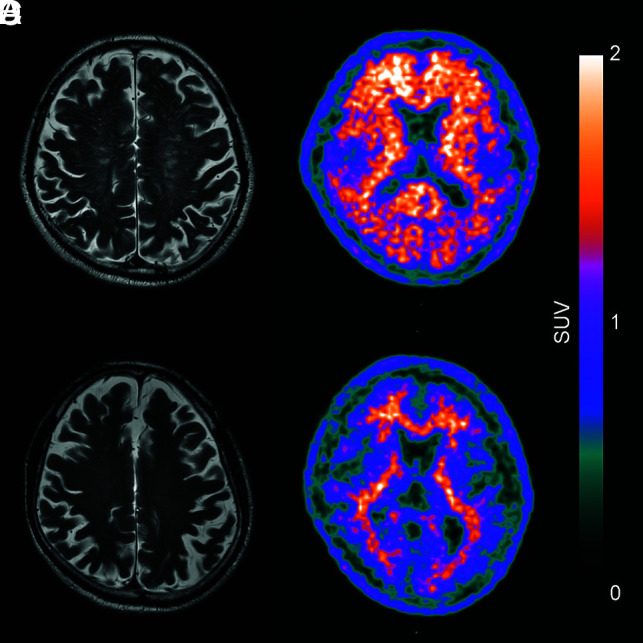
Examples of perivascular space patterns with the corresponding [18F] FBB PET image. The axial T2-weighted MR imaging shows a high degree of MR imaging–visible PVS-CS (A), and the corresponding [18F] FBB PET (B) shows pronounced β-amyloid deposition. Axial T2-weighted MR imaging shows a low degree of MR imaging–visible PVS-CS (C) and the [18F] FBB PET scan (D) shows low β-amyloid deposition.