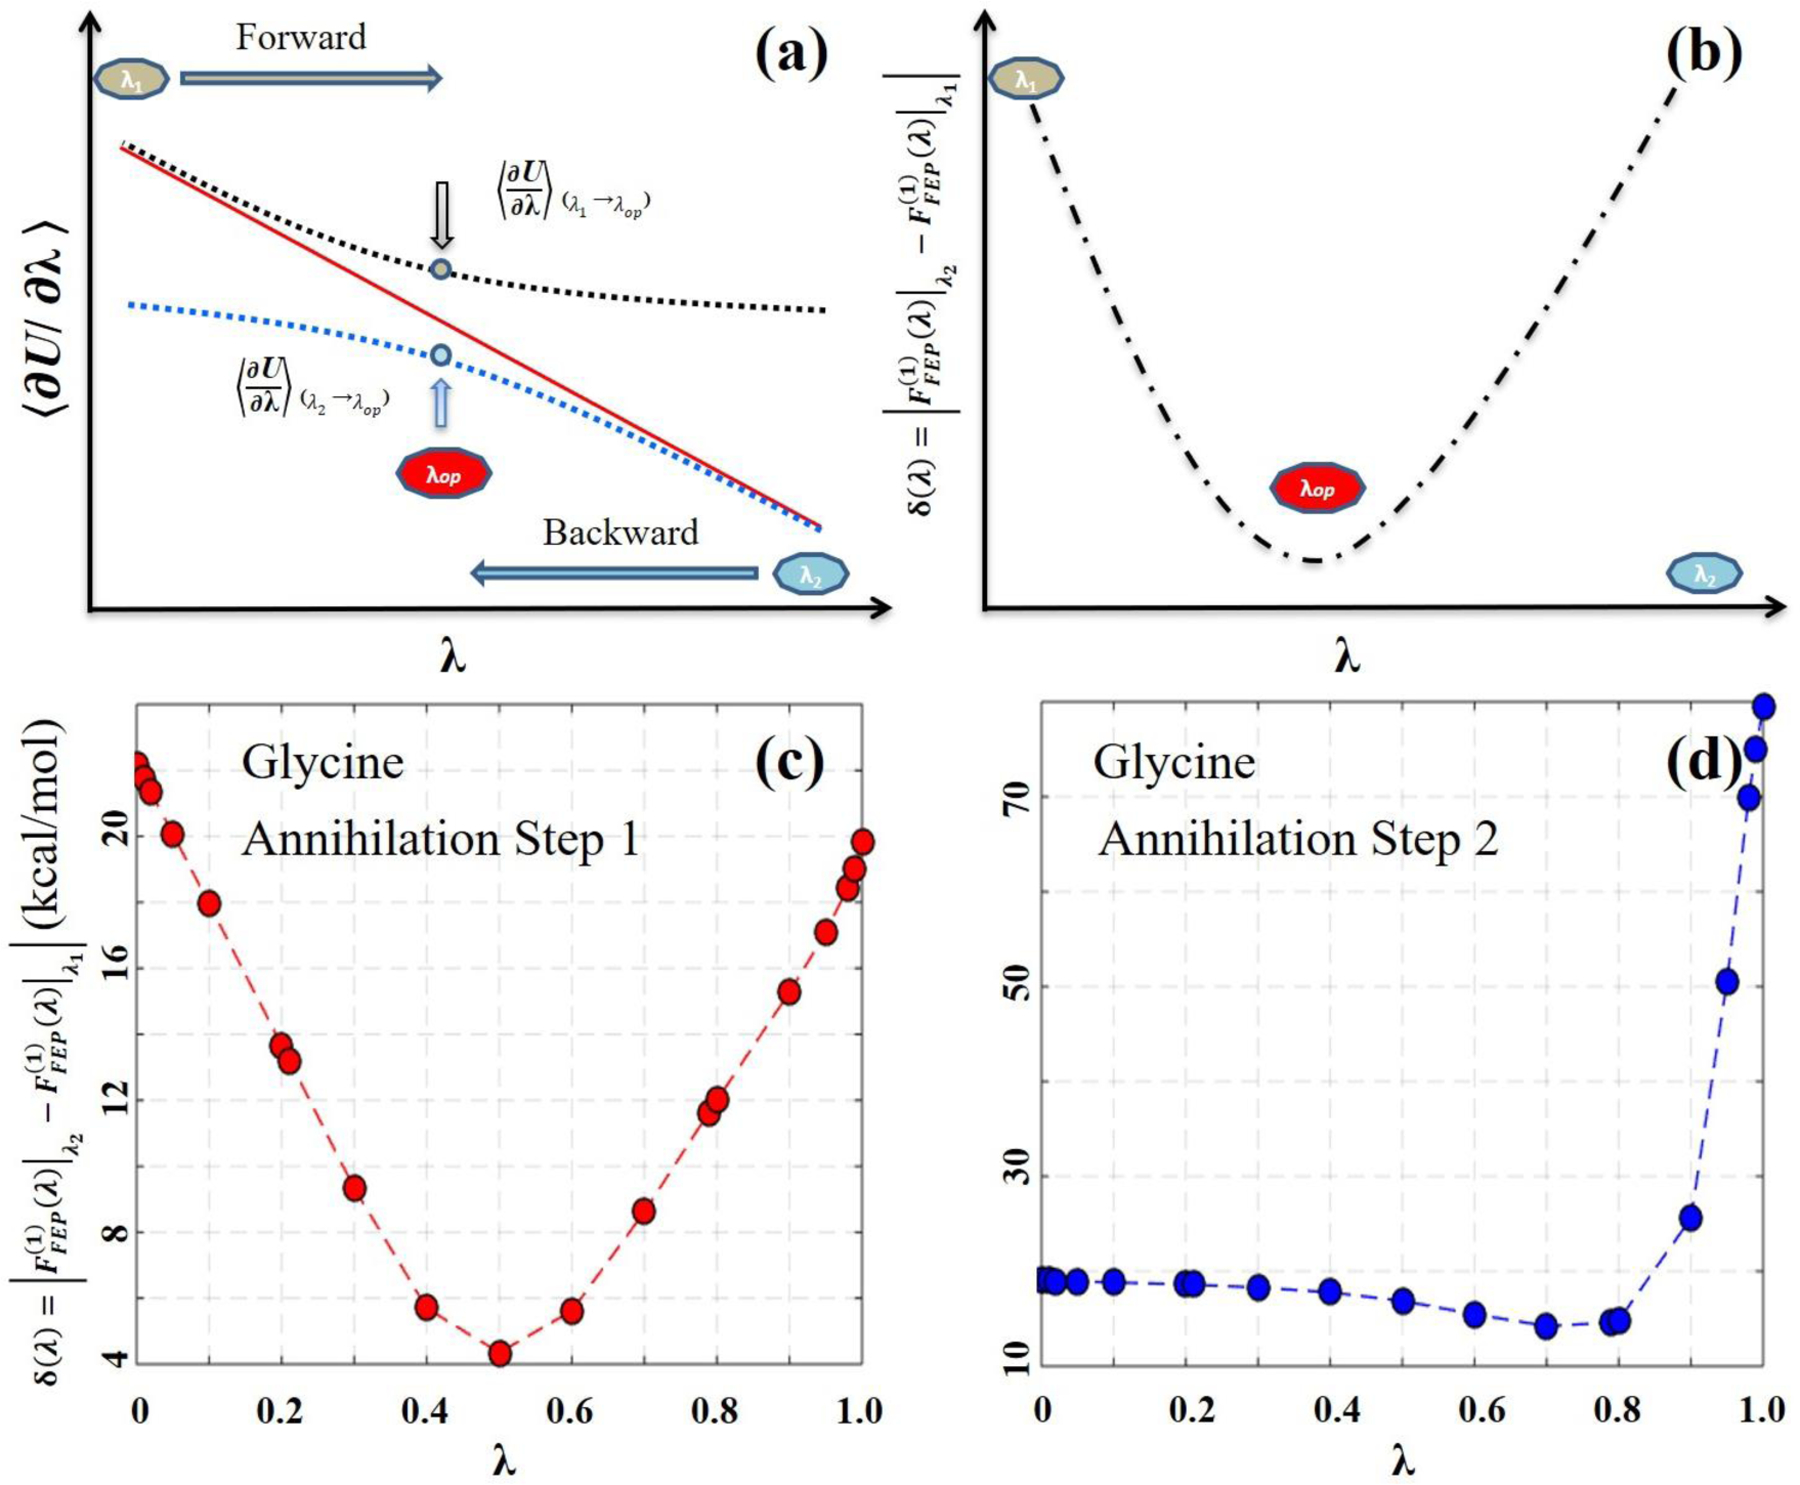
Figure 3.

Schematic illustration to identify an optimal λ value for the IPDW-FEP method. (a) The original and predicted TI integrands. The solid red line represents the original TI integrands determined from each λ simulation. The dashed blue lines represent the TI integrands predicted based on the configurations sampled at the two end-point λ values, i.e., λ0 and λ1. (b) The difference between the two predicted TI integrands, i.e., δ(λ) of eq. (13). The arrows in (a) indicate the λ value at the minimum of δ(λ) in (b), at which the DW-FEP calculation yields a minimum FE error.
