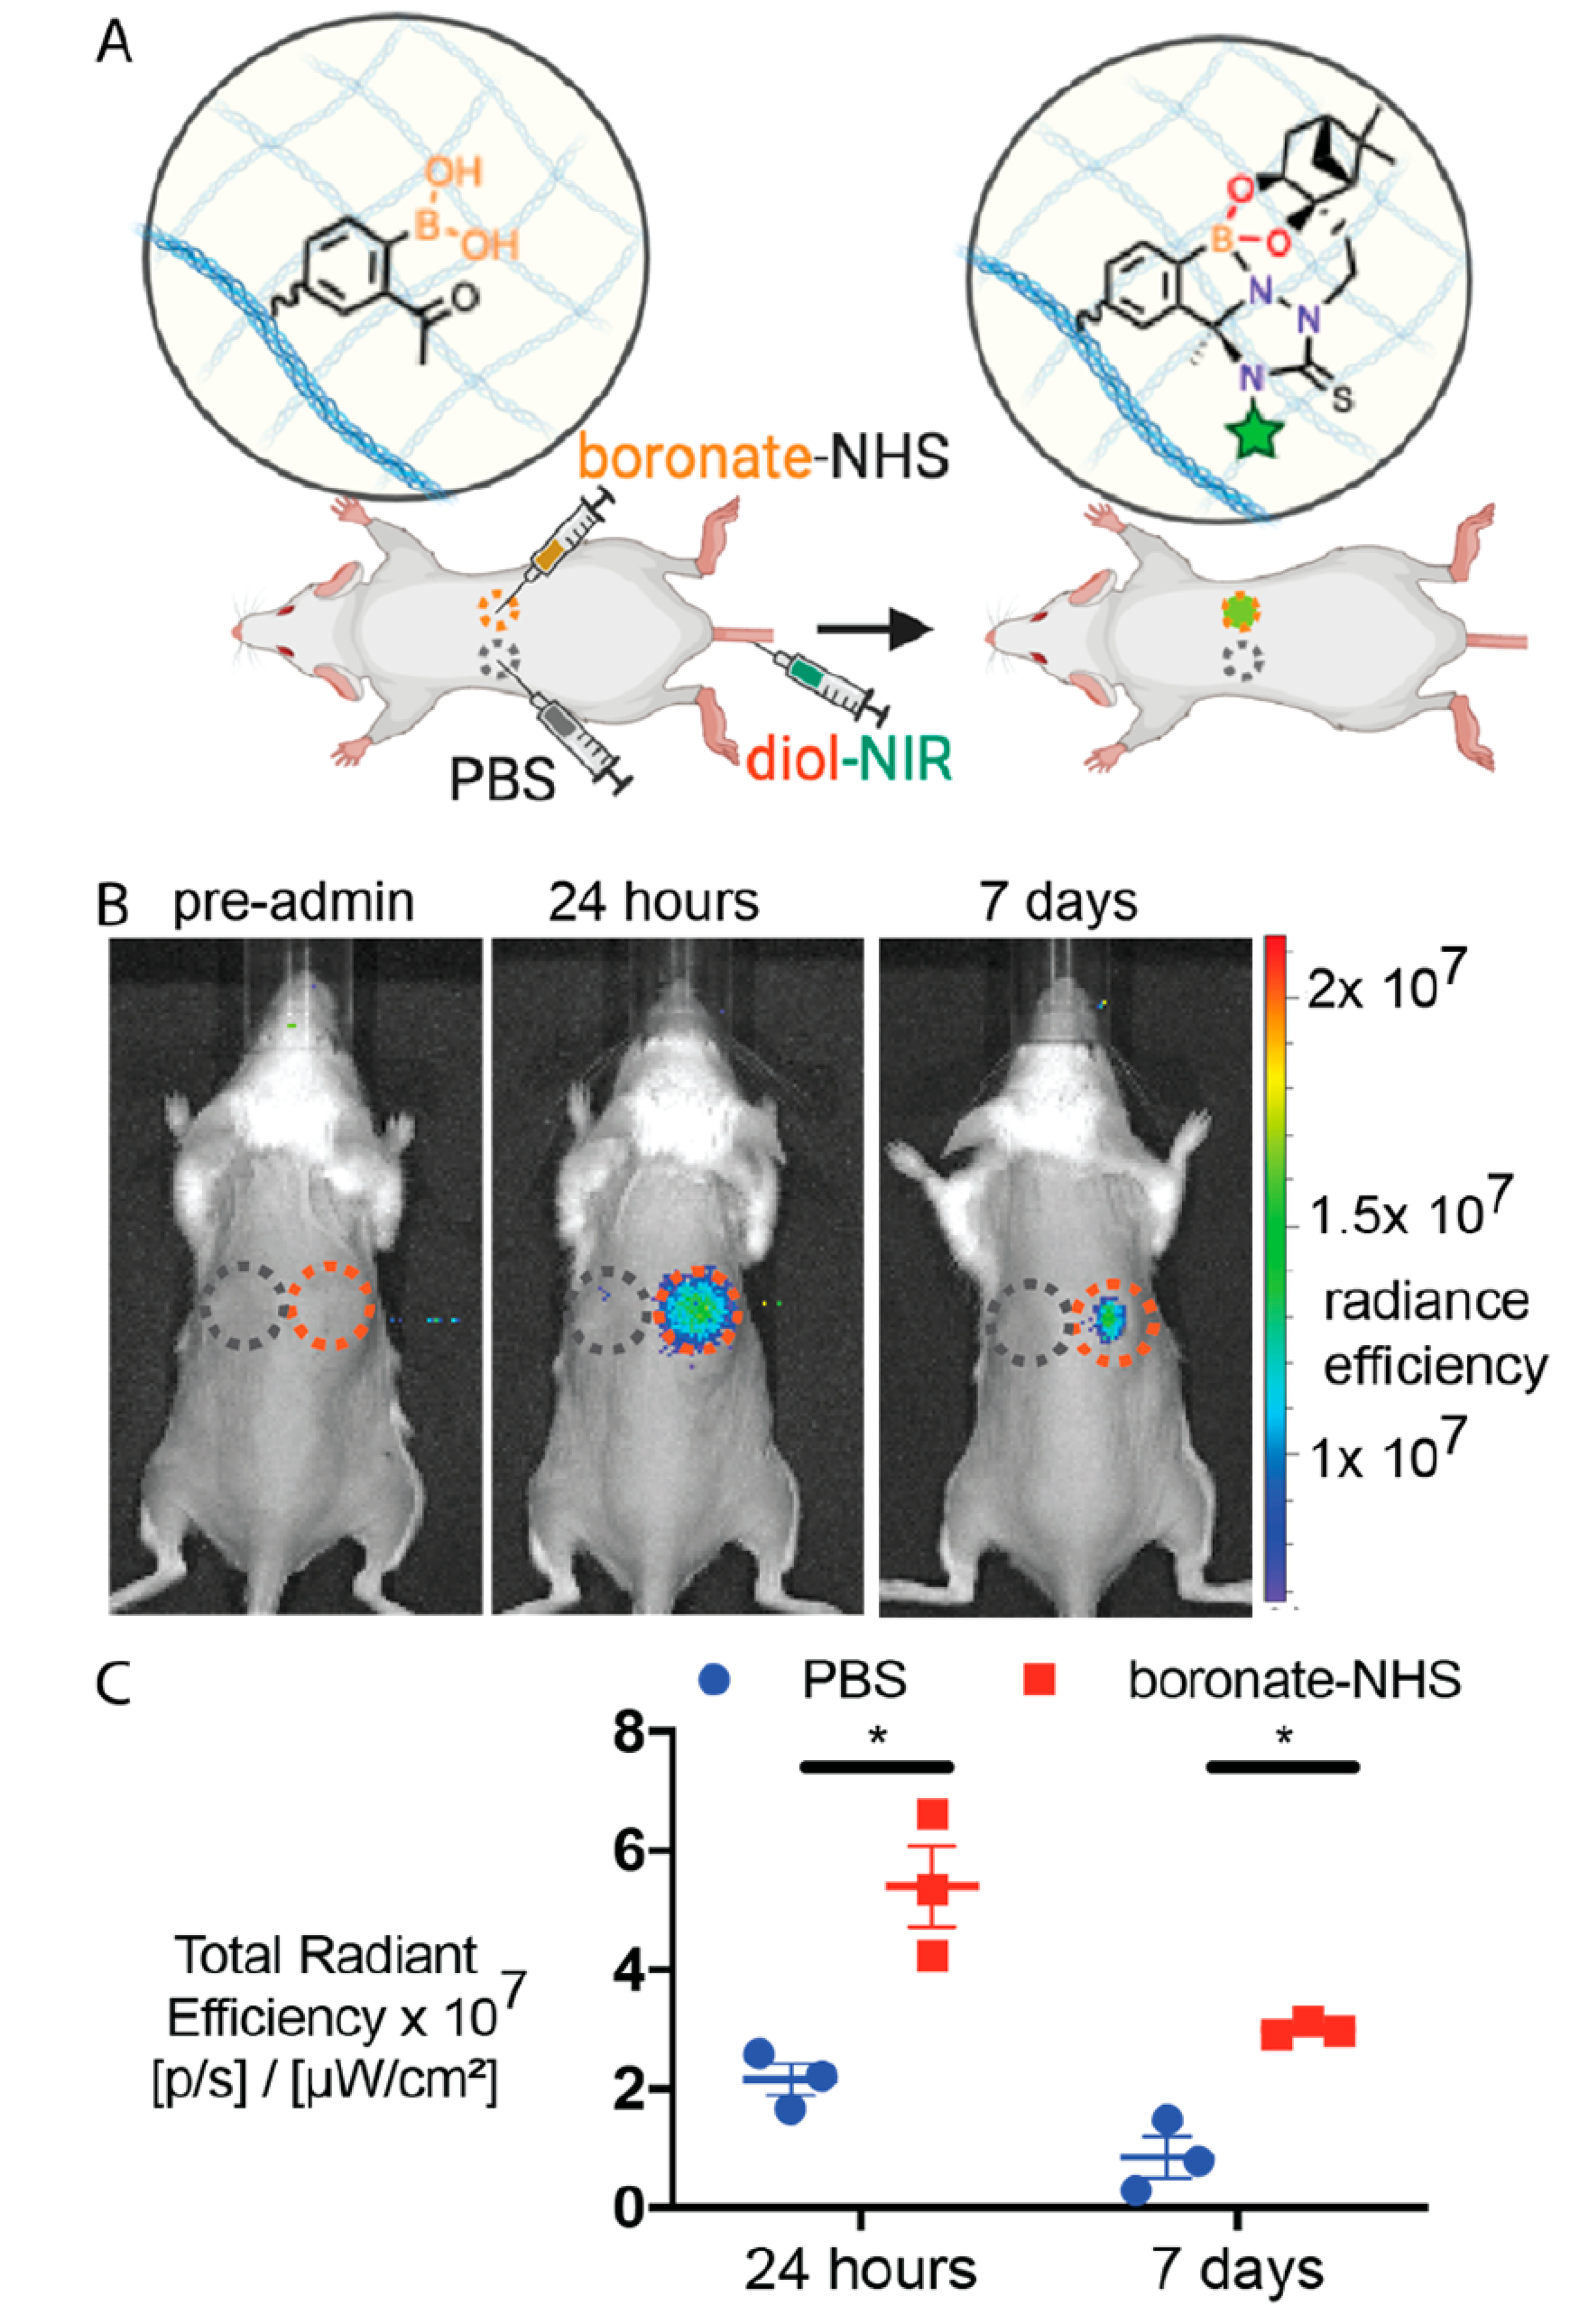
Figure 3.

In vivo validation of NAB—TAS coupling. (A) Schematic image of experiment. Boronic acids are anchored to tissue ECM and fluorescent diol is administered i.v. for click capture. (B) Representative IVIS images of mice before and 1 week after systemic administration of diol—NIR. Blue and red dashed circles indicate PBS and boronate—NHS injection sites, respectively. (C) Quantitation of fluorescence signal at injection site 24 h and 1 week after systemic administration of diol—NIR. Mean ± SEM (N = 3). Statistical significance was measured using a paired, one-tailed Student’s t test and represented as *p < 0.05. For full IVIS images of all mice at 0, 3, and 24 h and 7 days, see Figure S2.
