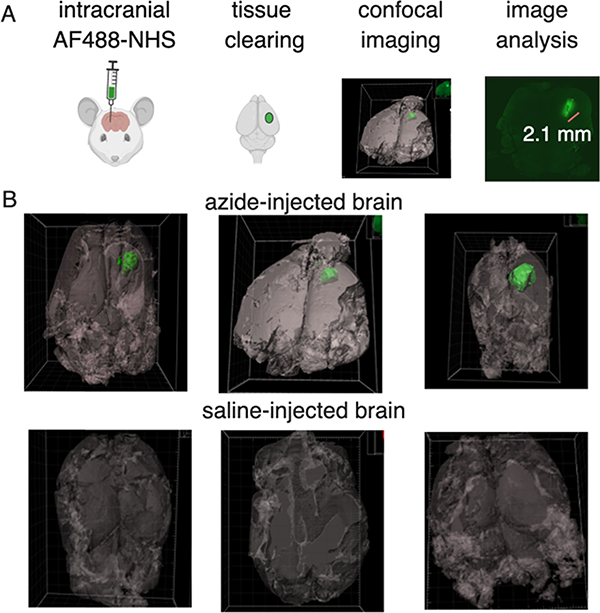
Figure 4.
Imaging NHS-ester distribution within a murine brain using model fluorescent NHS ester and tissue clearing. (A) Schematic of the azide depot visualization method from NHS injection, clearing, imaging, and analysis. (B) Representative green isosurfaces of the three Alexa Fluor 488 injected tumors and PBS-injected controls. Autofluorescence in tissues was visualized and set as a gray background.

