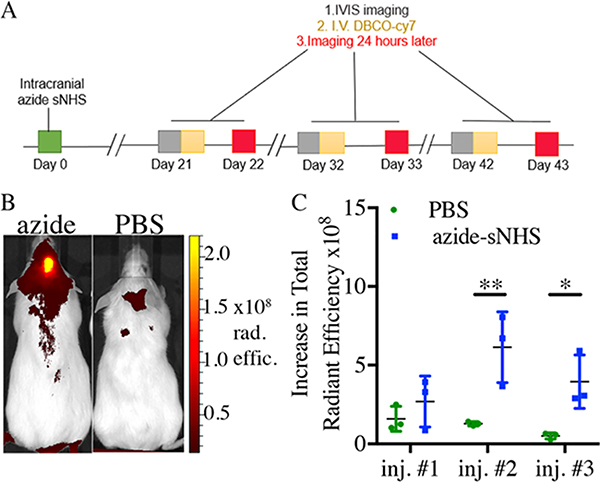
Figure 7.
Click-specific capture of small molecules in the brain. (A) Timeline of the intracranial-targeting experiment. (B) Representative images of azide-sNHS and control mice after three iv administrations of DBCO-Cy7. (C) Quantitation of intracranial ROI radiant efficiency measured 24 h after iv DBCO-Cy7 administration. Samples show mean ± SEM. *p < 0.05, **p < 0.01 by Student’s t-test. See Supporting Figures 19–21 for full images.

