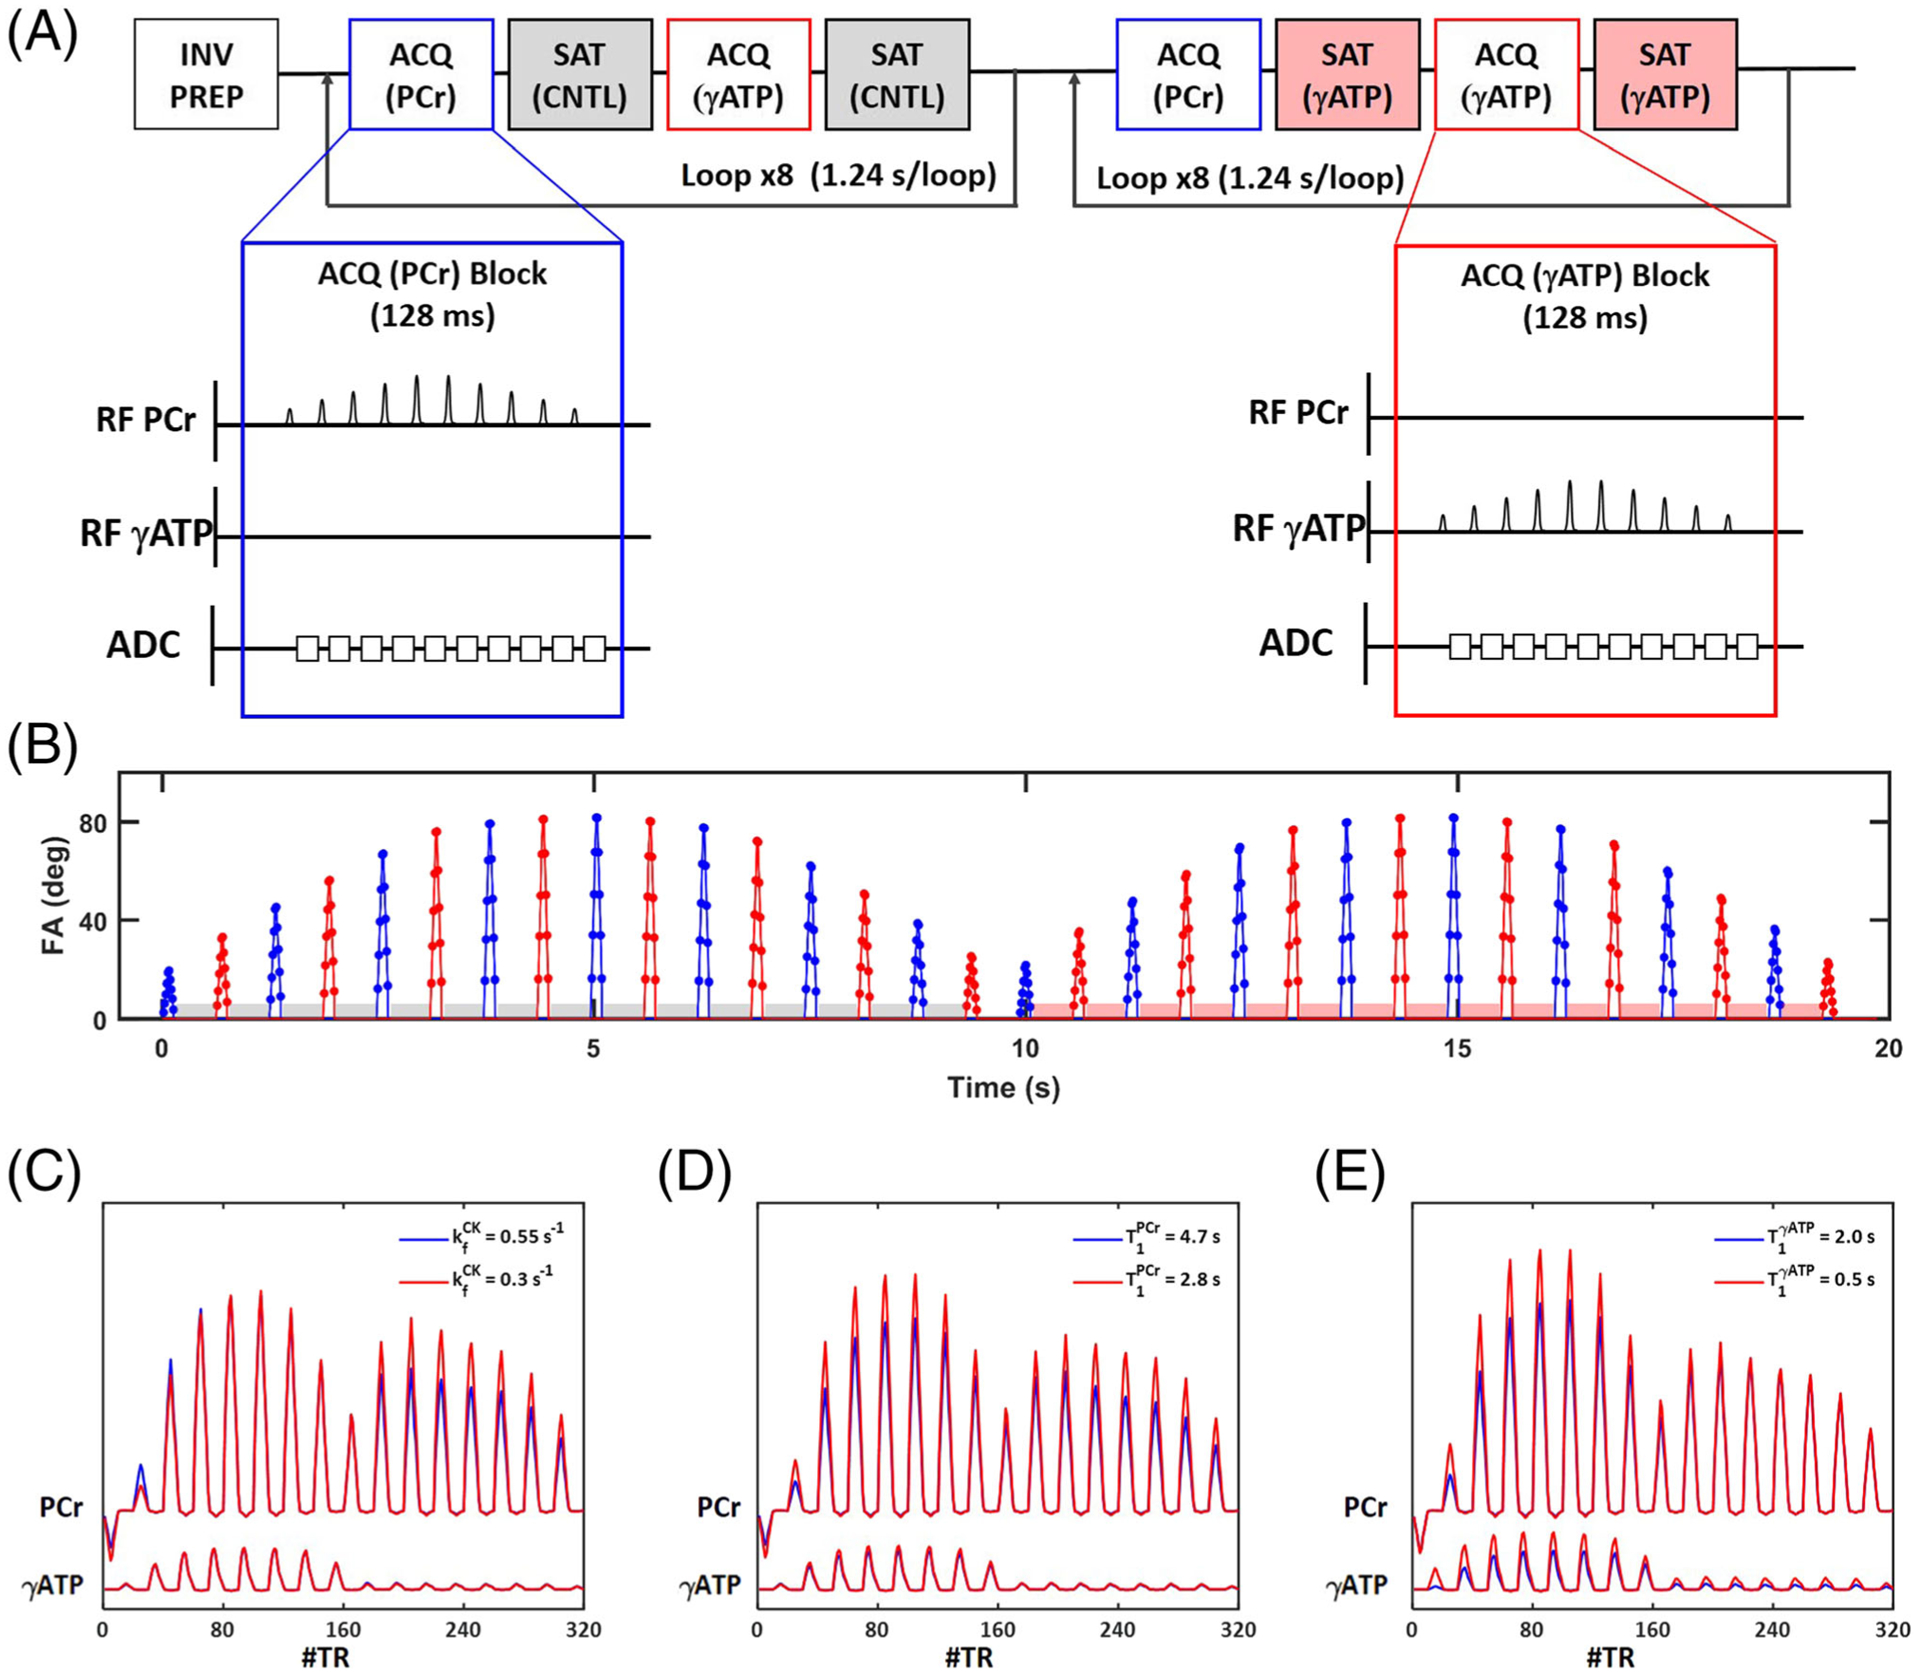
FIGURE 1.

31P-MRSF pulse sequence. A, Schematic diagram of the pulse sequence. Blue and red insets show a single acquisition block of PCr and γATP, respectively. INV PREP, inversion preparation; ACQ (PCr) and ACQ (γATP), acquisition blocks for PCr and γATP, respectively; SAT (CNTL) and SAT (γATP), contralateral and γATP saturation blocks, respectively. B, Timing and nominal FAs of all excitation pulses. Blue and red colors indicate PCr and γATP excitation, respectively. Red and grey shaded boxes indicate γATP and contralateral saturation blocks, respectively. C-E. Simulated fingerprints with one of the matching parameters (from C to E: , , and , respectively) varied
