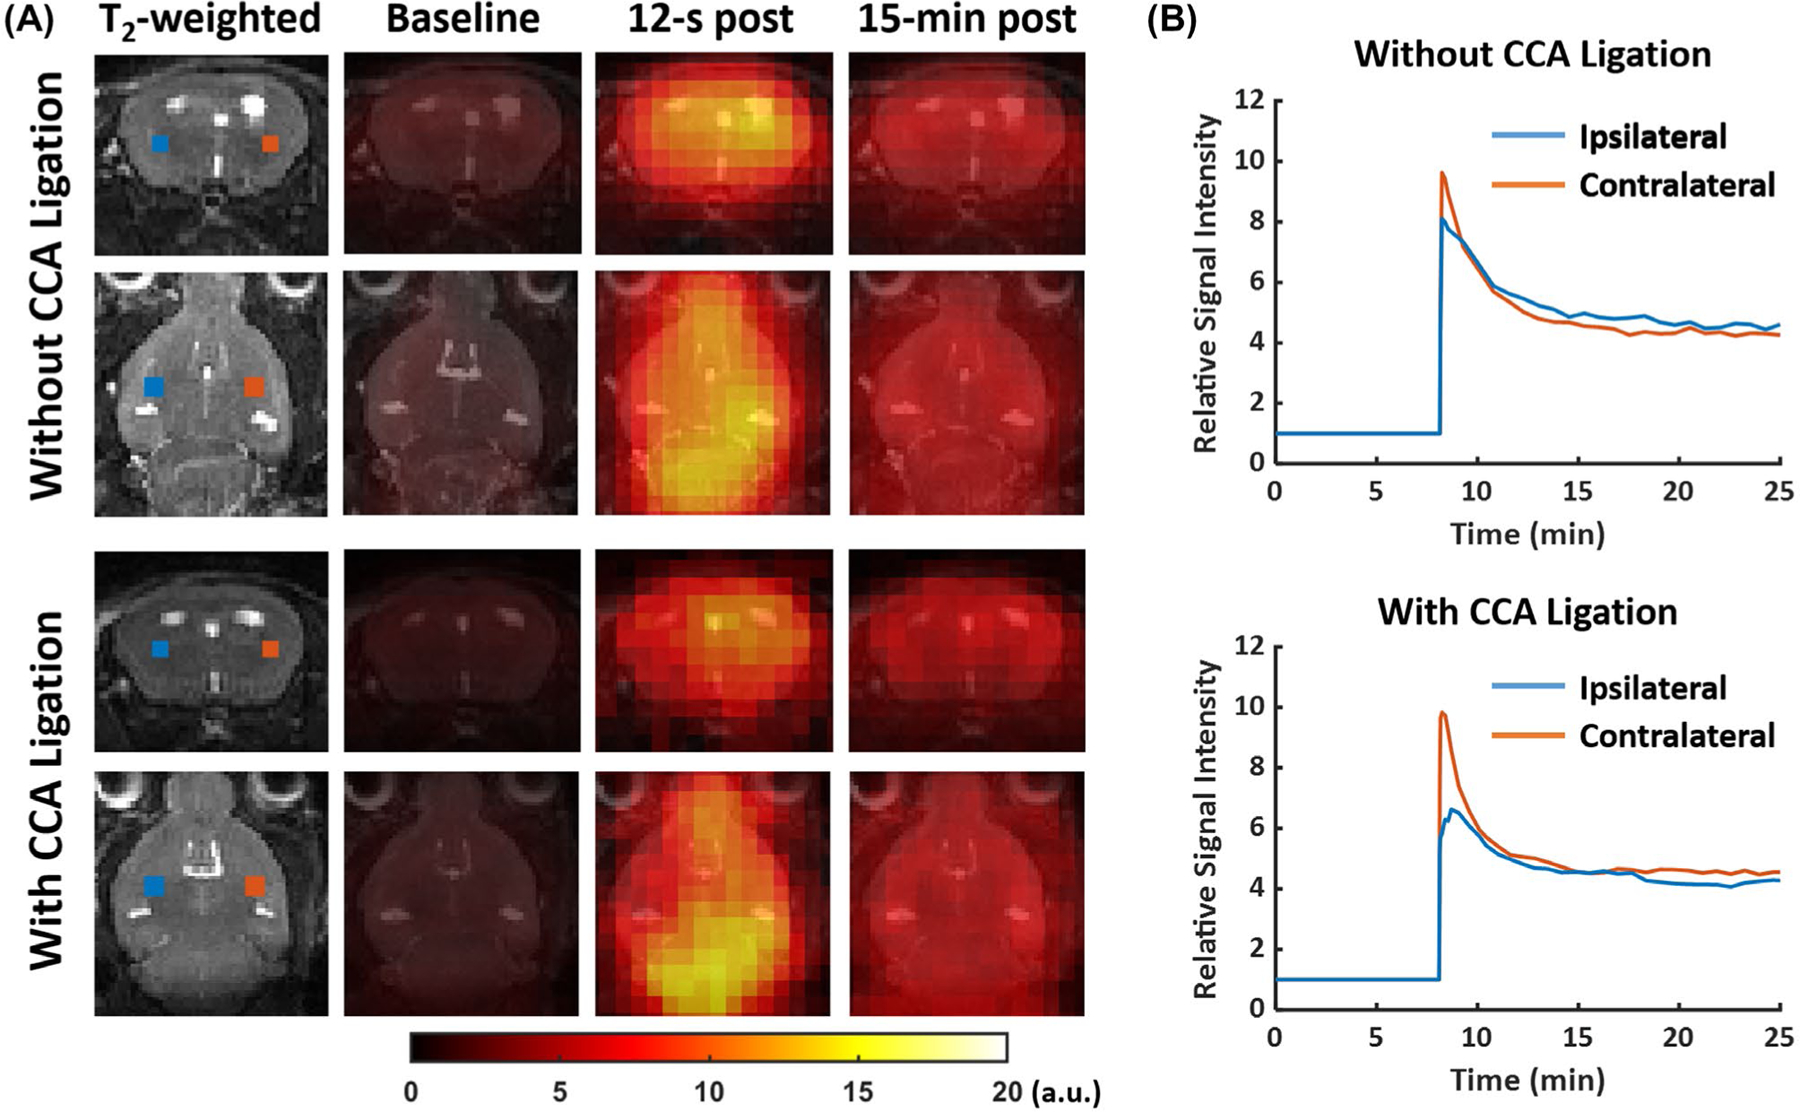
FIGURE 6.

Representative 17O images and dynamic 17O signals in post-stroke mouse brain. (A) T2-weighted images and reconstructed 17O images at baseline, 12 s, and 15 min post-H217O injection. (B) Baseline-normalized dynamic 17O signals in pixels from the ipsilateral (blue) and contralateral (red) hemispheres. The locations of the pixels are marked in the T2-weighted images in (A).
