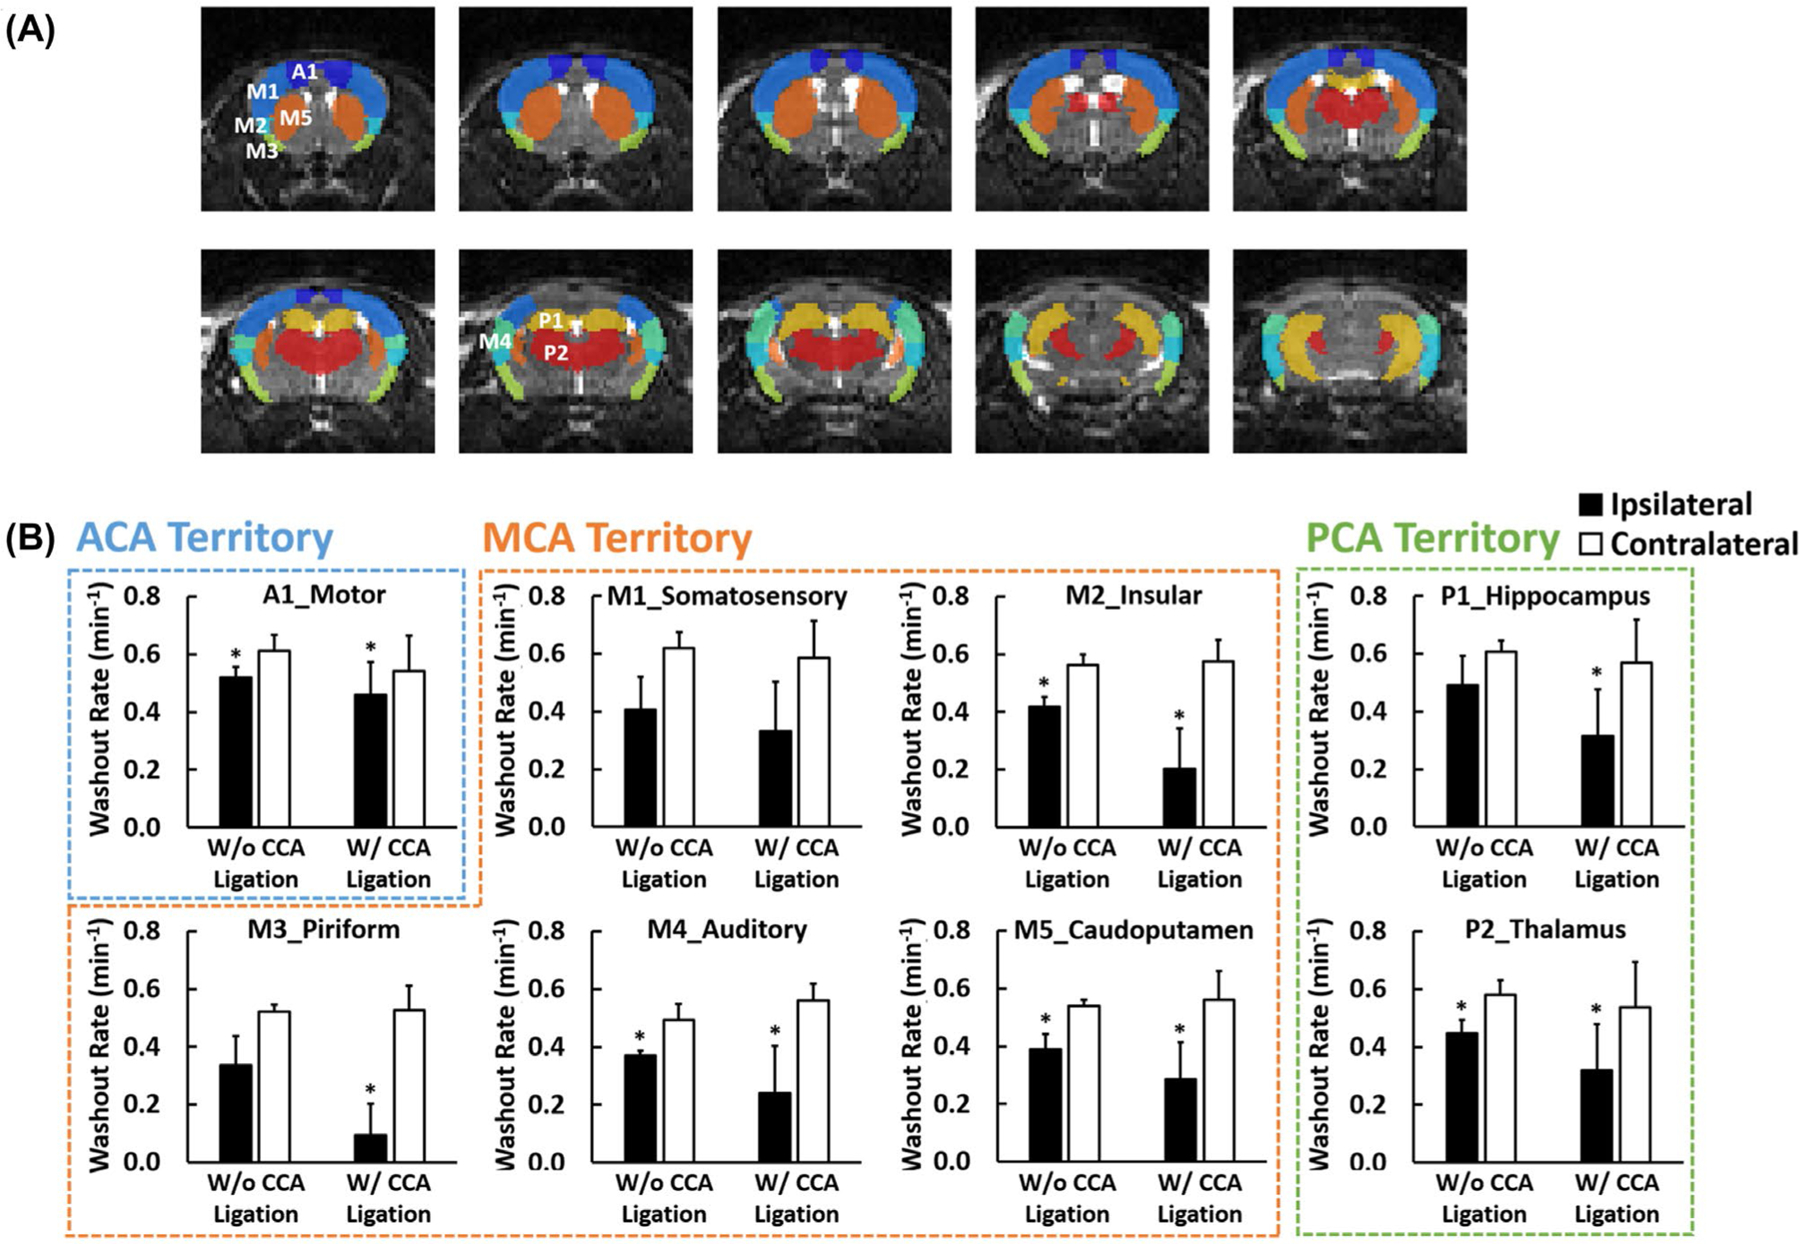
FIGURE 8.

Parameter comparisons in selected ROIs. (A) Segmentation of 8 ROIs. (B) Group-averaged H217O washout rate in the ipsilateral (solid bars) and contralateral (open bars) ROIs. A1, motor cortex (dark blue); M1, somatosensory cortex (blue); M2, insular cortex (light blue); M3, piriform cortex (green); M4, auditory cortex (cyan); M5, caudoputamen (brown); P1, hippocampus (yellow); P2, thalamus (red); ROI, region of interest.
