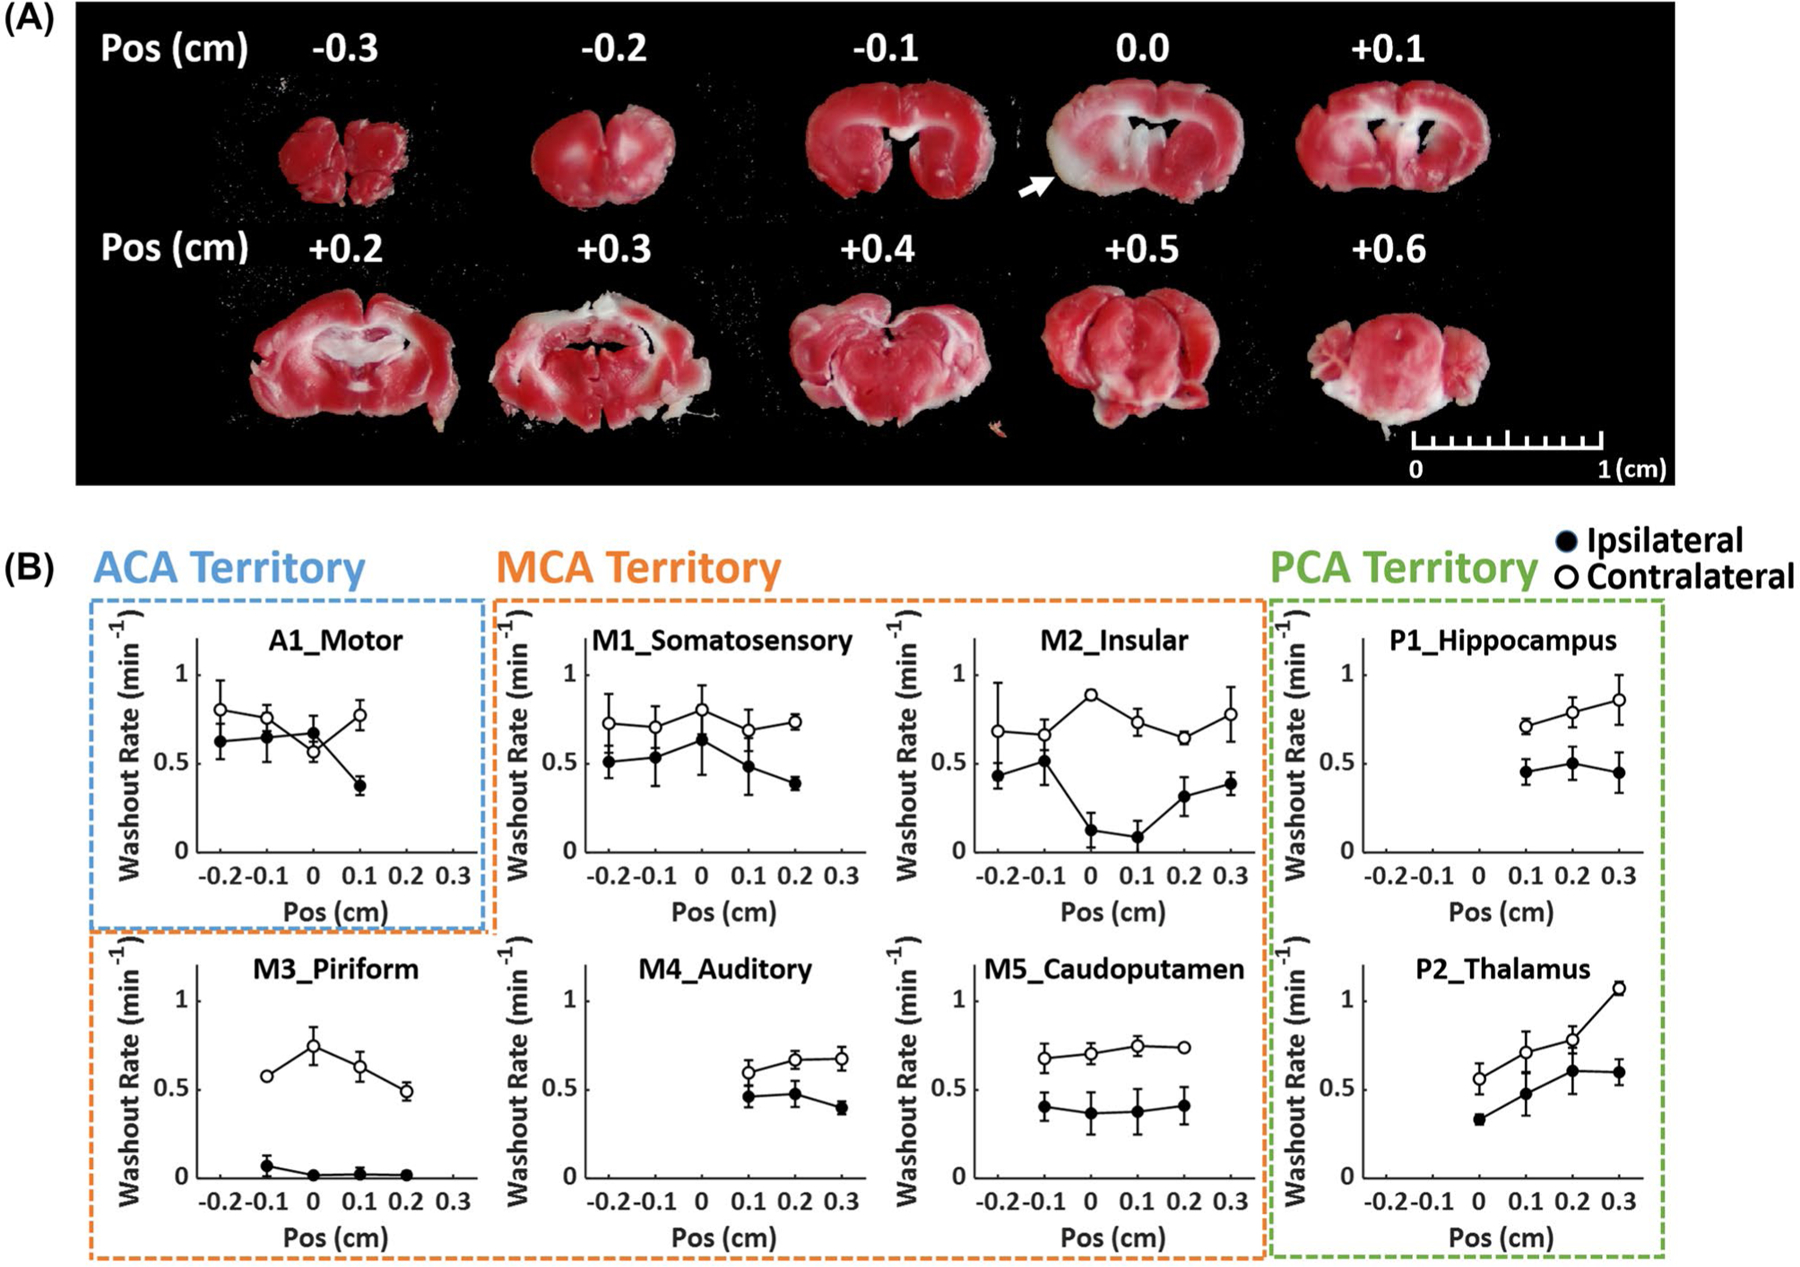
FIGURE 9.

Correlation between 17O kinetics and TTC staining. (A) TTC staining of a mouse with CCA ligation. Arrow indicates the infarct lesion. (B) Anteroposterior changes in H217O washout rate in selected ROIs. Closed and open circles represent ipsilateral and contralateral ROIs, respectively. Position (Pos) indicates distance relative to the slice with TTC-stained lesion, with negative sign on the anterior side and positive sign on the posterior side. CCA, common carotid artery; Pos, position.
