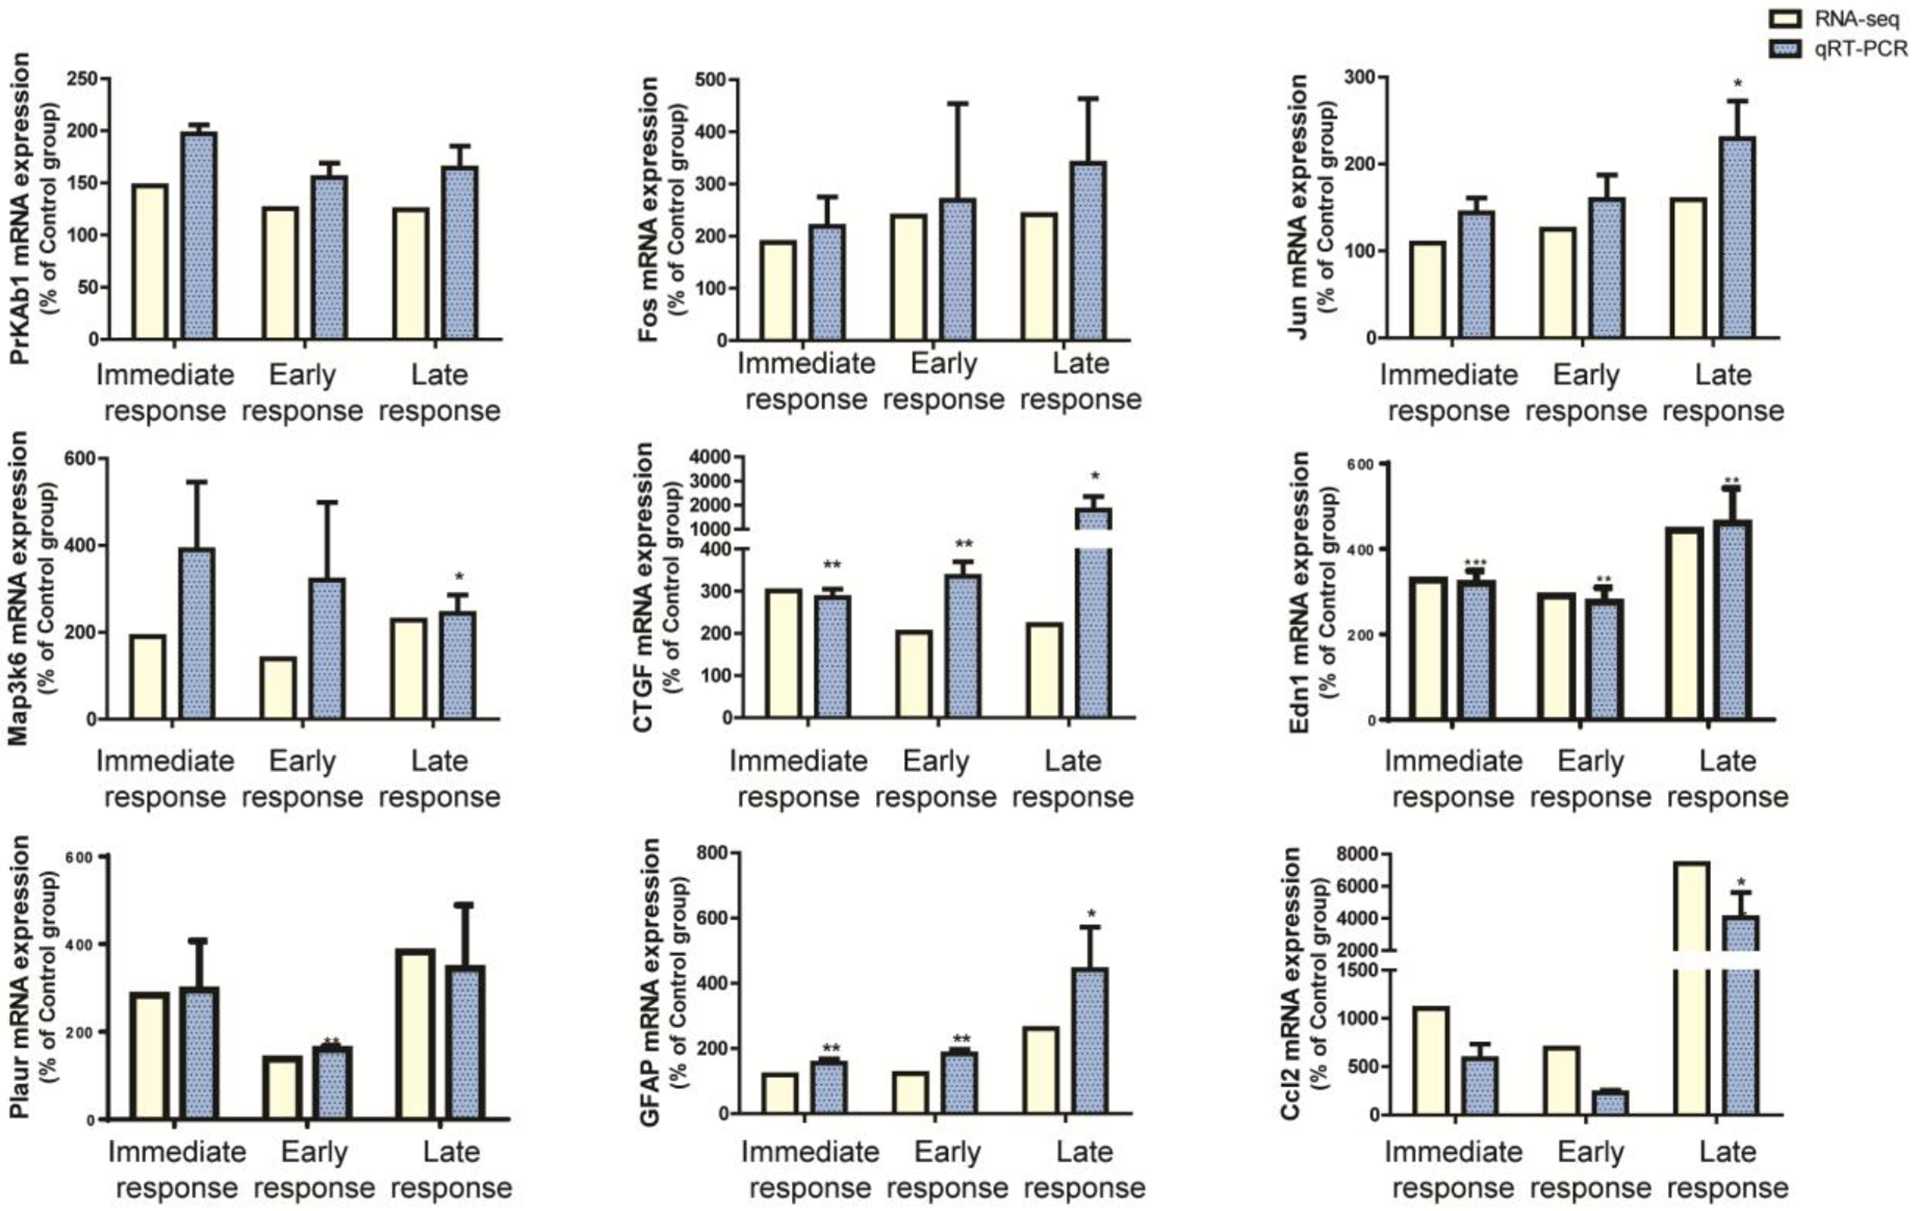
Figure 3.

RNAseq analysis of the IC of H2S exposed mice were validated with quantitative real-time PCR.
Expression profiles of RNAseq analyses in the IC were validated with the analyses of quantitative real-time PCR. Genes that were differentially expressed in common throughout H2S exposure were selected for this analysis. Expressions of genes were measured by quantitative real-time PCR (n>3) and compared to gene expression profiles of RNAseq analyses in the IC. Values of quantitative real-time PCR were normalized to Gapdh expression. Significant difference were determined by t-test by comparison to the breathing air control group and were indicated with *(p<0.05) or **(p<0.01).
