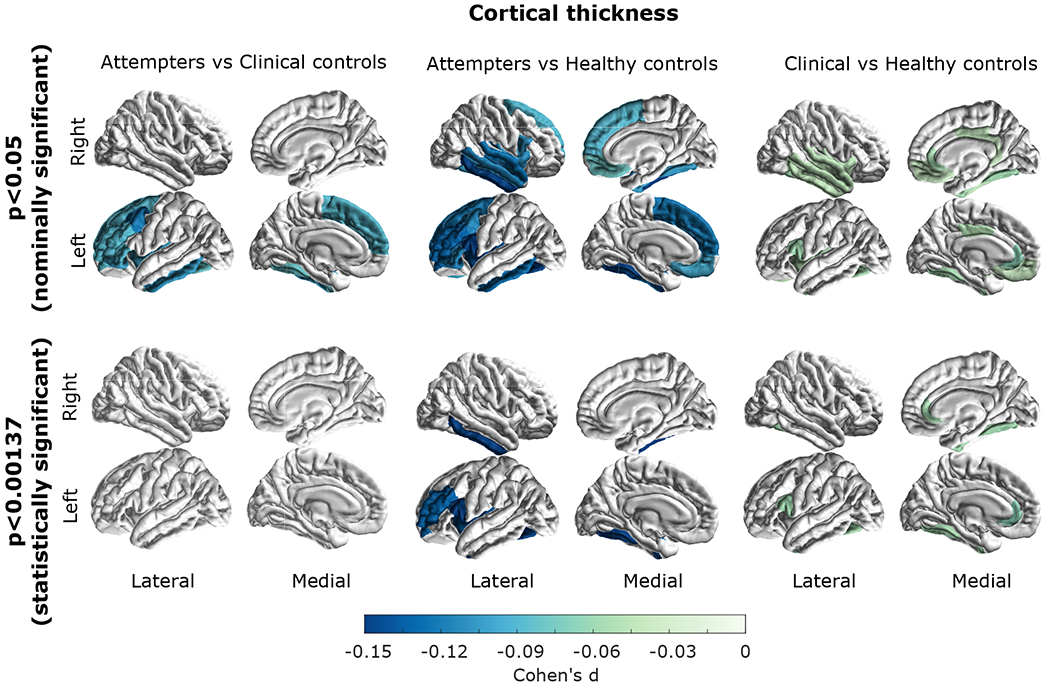
Figure 3. Group differences in cortical thickness.

Effect sizes are shown for regions that displayed a (top) nominally significant (p<0.05) or (bottom) a statistically significant (p<0.001373 threshold after multiple test correction) post-hoc difference between attempters and healthy controls (left panel), attempters and clinical controls (middle panel) and clinical controls compared to healthy controls (right panel). All of the colored regions showed a statistically significant group effect (FDR<0.05).
