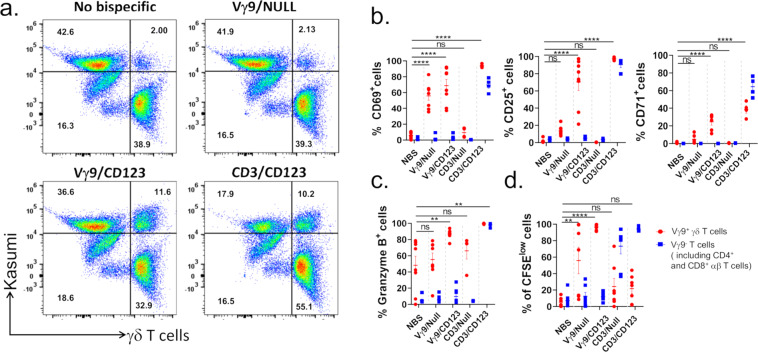
Fig. 2. Vγ9/CD123 bispecific antibody mediates selective recruitment, activation differentiation, and proliferation of Vγ9+ γδ T cells.
Cell trace green labelled enriched γδ T cells (effectors) were co-cultured with cell trace yellow labelled kasumi-3 cells (targets) at 1:1 ET ratio in the presence of 1 µg/mL of indicated bispecific antibody at 37 °C for 1 h. Cell–cell association was determined using flow cytometry and quantified as double positive cells in upper right quadrant of FACS plot (a). Numbers in quadrants indicate the frequency of respective population (a). b and c CFSE labelled Pan T-cells (effectors) from fresh PBMCs were co-cultured with Kasumi-3 cells (targets) at 1:1 ET ratio in the presence or absence of indicated bispecific antibodies at 37 °C for 72 h. Scatter plot graphs mirror the mean (±SEM) frequency of Vγ9+ γδ T cells and Vγ9- γδ T cells (includes CD4+ and CD8+ T cells) that were positive for CD69 (left), CD25 (middle) and CD71 (right) surface expression (b), intracellular Granzyme B expression (c), and CFSE dilution (d). Red circle and blue square represent Vγ9+ γδ T cells and Vγ9- T cells (includes CD4+ and CD8+ αβ T cells), respectively. Each dot represent data from an individual donor. The p values were calculated with a one-way ANOVA and Dunnett’s multiple comparison test (*p < 0.05, **p < 0.01, ***p < 0.001, ****p < 0.0001, and ns suggests p > 0.05). NBS No bispecific antibody.

