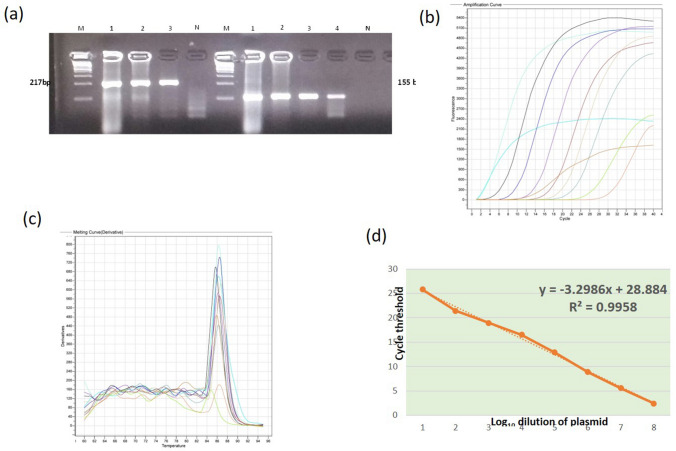
Fig.1.
a Amplification of VP1 gene regions by primer sets in conventional PCR. M: 100 bp ladder, lane 1–4 positive control showing amplification of 217 bp and 155 bp products with primer sets, N: No template control b Amplification of serially diluted plasmid DNA in real time PCR assay (c) Melting curve for primer set 2 in real time PCR assay d Standard curve for Primer set 1. R2: the coefficient of determination

