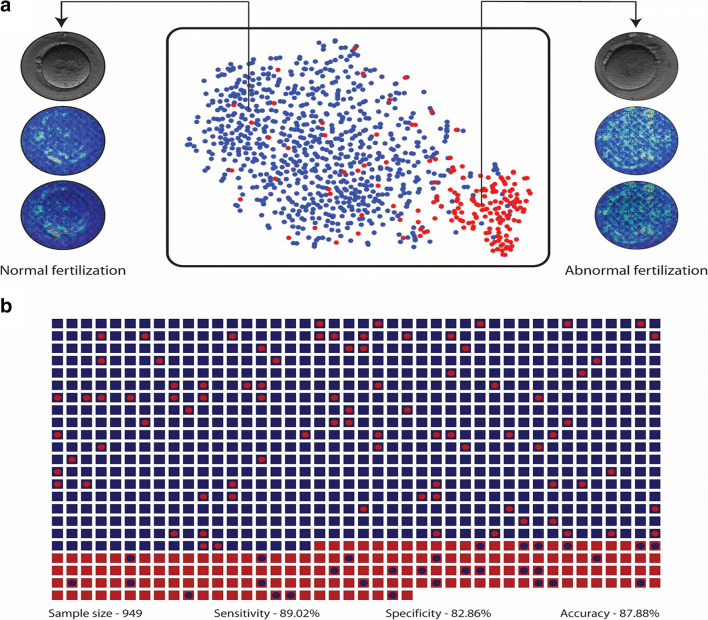
Fig. 1.
Fertilization assessment. a The t-SNE plot for the Xception model trained to classify abnormally fertilized embryos (non-fertilized, 3PN, 1PN etc. embryos) and normally fertilized embryos (2PN embryos). The saliency map of the two embryos provides an example of the features that network uses to classify embryos at the pronuclear stage. b The dot matrix plot illustrates the system’s performance in evaluating embryos (n=947) from the test set of patients. The squares represent true labels and the circles within them represent the system’s classification. Blue squares and circles represent normally fertilized embryos while red squares and circles represent abnormally fertilized embryos

