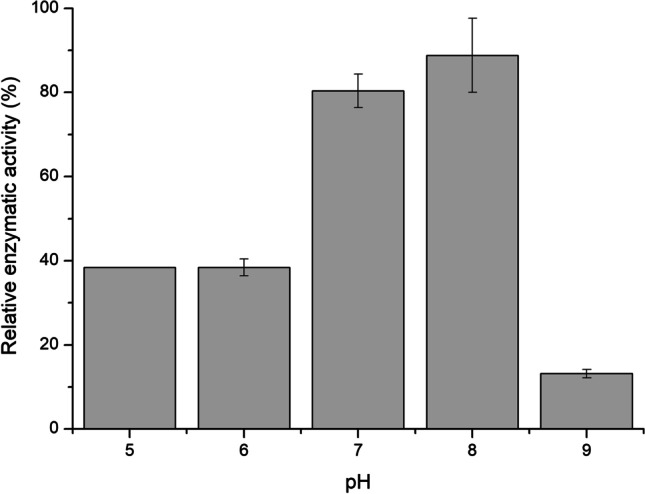
Fig. 1.

Optimal relative pH activity of the expressed TGase. The cells of E. coli were disrupted using the following buffers: pH 5 (0.1 M sodium acetate), pH 6 (0.1 M sodium phosphate), pH 7 (0.1 M sodium phosphate), pH 8 (0.1 M Tris–HCl), and pH 9 (0.1 M Tris–HCl). The results represent the mean of duplicates, considering the highest activity detected as 100%
