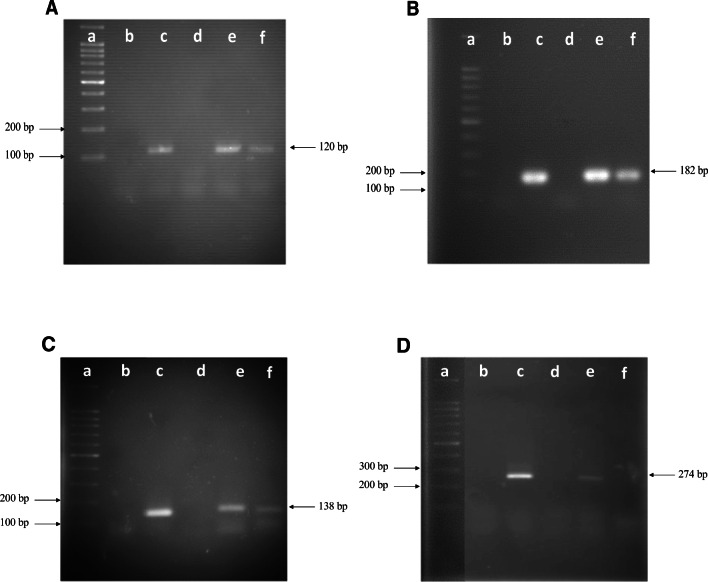
Fig. 2.
Detection of the entP (120 bp; a), entiP (182 bp; b), entTW21 (138 bp; c) and entiTW21 (274 bp; d) genes by PCR and their transcription by RT-PCR. The analyses were done with cDNA obtained from the RNA extracted after 6 and 10 h of incubating E. faecium E86 strain cultures, and the amplicons were detected by electrophoresis on 1.8% agarose gels in TAE buffer, at 90 V for 1.5 h. a 100-bp DNA Ladder ready-to-use (Sinapse Inc). b blank (samples without nucleic acid); c positive control of the reaction (amplification of the gene from DNA); d negative control of the reaction (DNA of E. coli strain DH5α); e cDNA obtained from RNA extracted after 6 h of culturing E. faecium E86; f cDNA obtained from RNA extracted after 10 h of culturing E. faecium E86. The numbers to the left of the figure indicate the size of some DNA fragments present in the molecular size marker. The number to the right of each figure corresponds to the size of the expected amplicon

