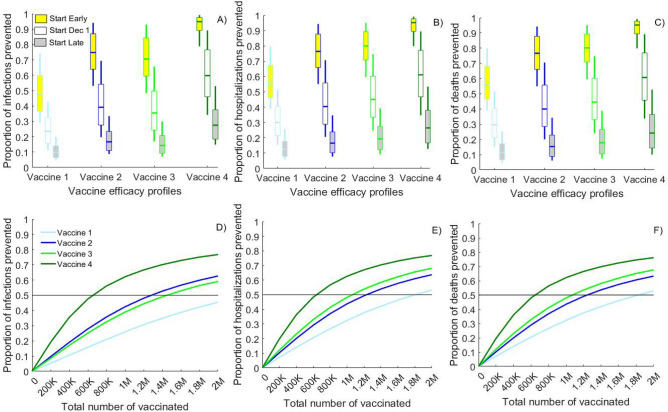
Figure 4.
Importance of the timing and the coverage achieved with the vaccine rollout. Comparison of the projected reductions in the number of: (A,D) cumulative infections; (B,E) cumulative hospitalizations and (C,F) cumulative deaths over 1 year due to the use of vaccines with different efficacy profiles compared to base-case scenarios without vaccination. (A–C) compare vaccine rollouts which start on Dec. 1, 2020 (white boxes), Sept. 1, 2020 (yellow boxes) or March 1, 2021 (gray boxes) assuming 5000 vaccinated daily till 1,000,000 vaccinations are reached. (D–F) show the impact of rollouts starting on Dec. 1, 2020 and reaching different number of total vaccinations over 200 days. Vaccine 1 (10% VESUSC and 44.4% VESYMP) and Vaccine 2 (40% VESUSC and 16.7% VESYMP) result in 50% reduction in symptomatic disease (VEDIS) while Vaccine 3 (10% VESUSC and 88.9% VESYMP) and Vaccine 4 (80% VESUSC and 50% VESYMP) result in 90% VEDIS. Lines represent the mean value while boxplots represent the uncertainty generated by 100 calibrated simulations.

