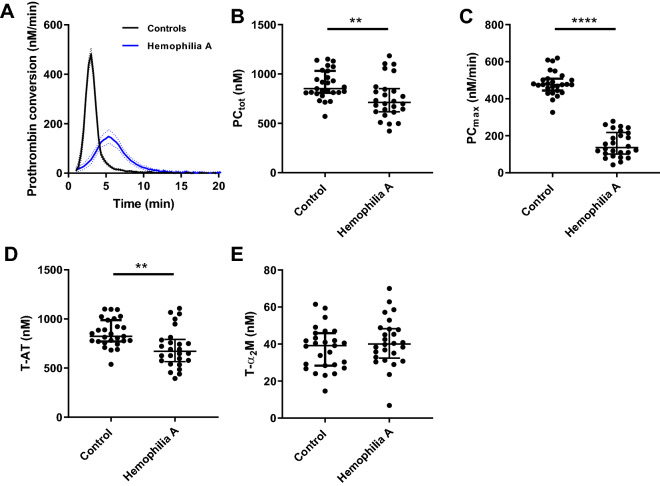
Figure 4.
Prothrombin conversion in haemophilia A triggered with 5 pM tissue factor. Prothrombin conversion curves were determined from TG curves measured at 5 pM TF. (A) Average prothrombin conversion curves for the patient and control group. Individual TG curves were quantified by the total prothrombin conversion (PCtot, B), maximum prothrombin conversion rate (PCmax, C), thrombin-antithrombin complex formation (T-AT, D), and thrombin-α2macroglobulin complex formation (T-α2M) (E). Prothrombin conversion curves are depicted as the mean curve (continuous line) ± the 95% confidence interval (dotted lines) and the parameter values are shown as the individual values with the median ± interquartile range. Statistical significance according to the Mann Whitney test is indicated as ** for a p-value < 0.01, **** for a p-value < 0.0001.

