Figure 3.

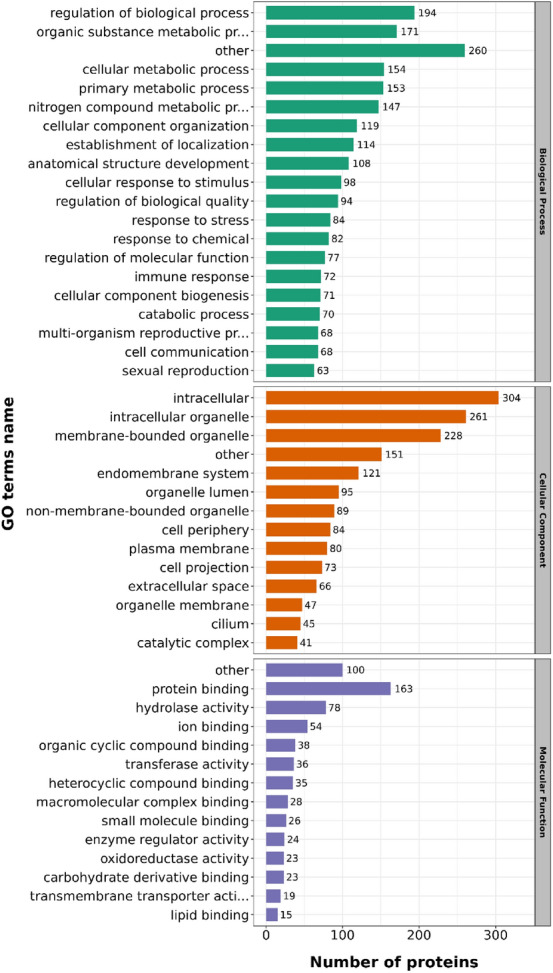
Statistical distribution chart of the identified DAPs based on each GO category. The DAPs were classified into biological process, cellular compartment and molecular function. The bar represents the number of DAPs.

Statistical distribution chart of the identified DAPs based on each GO category. The DAPs were classified into biological process, cellular compartment and molecular function. The bar represents the number of DAPs.