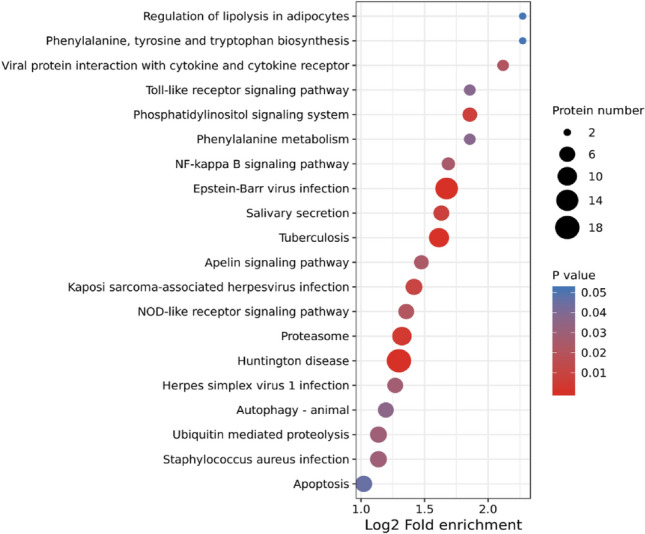
Figure 5.

Kyoto Encyclopedia of Genes and Genomes (KEGG) pathway enrichment analysis of DAPs. The P value was calculated using a Fisher’s exact test. The X-axis represents the Log2 transformed ratio of DAPs compared to the identified proteins, and the Y-axis means KEGG pathway. The size of each bubble refers to the number of the DAPs. The color indicates the significance P value, and the size of circle indicates the number of DAPs in terms.
