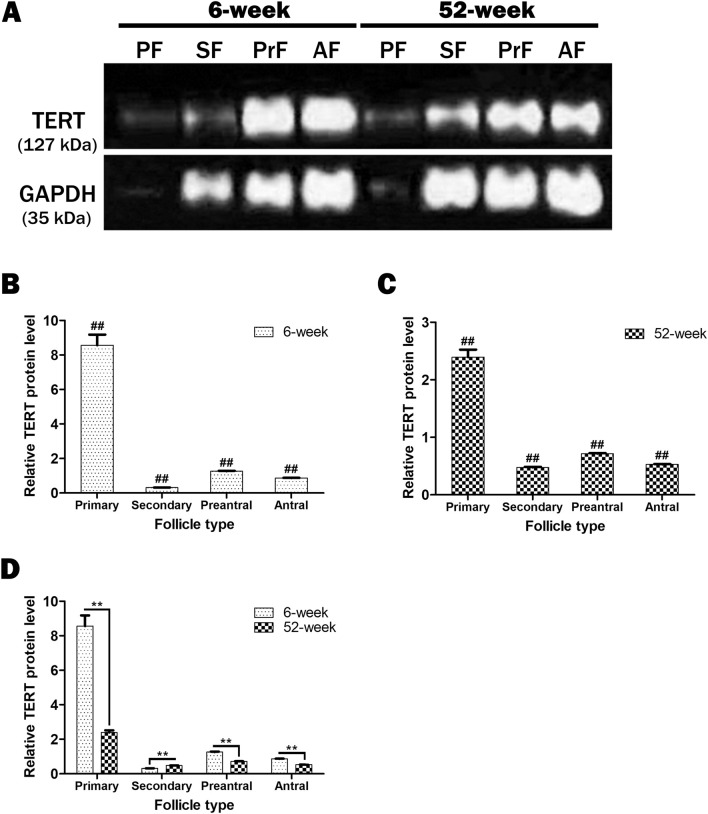
Figure 3.
The TERT protein levels in the ovarian follicles from primary to antral stages, obtained from adult (6-week-old) and aged (52-week-old) groups. In this analysis, we used primary (n = 60 and 46), secondary (n = 77 and 58), preantral (n = 59 and 64), and antral (n = 56 and 38) follicles from 14 adult and 9 aged mice, respectively. (A) Western blotting (WB) results showing bands corresponding to the TERT and glyceraldehyde-3-phosphate dehydrogenase (GAPDH) proteins in the isolated follicles. GAPDH (in the molecular weight of 35 kDa) was used as an internal loading control. All the follicles either from adult or aged groups possessed the TERT protein (in the molecular weight of 127 kDa) at different levels. The bands produced via WB were analyzed using the ImageJ software program version 2.0 (bundled with 64-bit Java 1.8.0_172; NIH, Bethesda, Maryland, USA, URL link: https://imagej.nih.gov/ij/download), and the results were presented as a column chart. PF primary follicles, SF secondary follicles, PreF preantral follicles, AF antral follicles. (B) The relative TERT protein levels in the follicles from the adult group. The highest and lowest TERT protein levels were observed in the primary (P < 0.01) and secondary (P < 0.01) follicles, respectively. It should be noted that there were statistical significances among all follicle types (##P < 0.01). (C) The relative TERT protein levels in the follicles from the aged group. It progressively decreased from primary to antral follicles except for the secondary follicles, where a marked reduction was observed (P < 0.01). It is worth noting that there were statistical significances among all follicle types (##P < 0.01). (D) The comparison of relative TERT protein levels in the follicles between adult and aged groups. In the aged group, we detected lower TERT protein levels in the primary, preantral, and antral follicles (P < 0.01), but higher levels in the secondary follicles (P < 0.01) when compared to those of their adult counterparts. There were statistical significances among all follicle types (**P < 0.01). Here, the statistical significances in B and C were evaluated using one-way ANOVA test and the Student–Newman–Keuls post hoc test (denoted by ##); the student’s t-test (denoted by **) was used in D. The data obtained are presented as means ± standard deviations (SDs; arising from two technical repeats).

