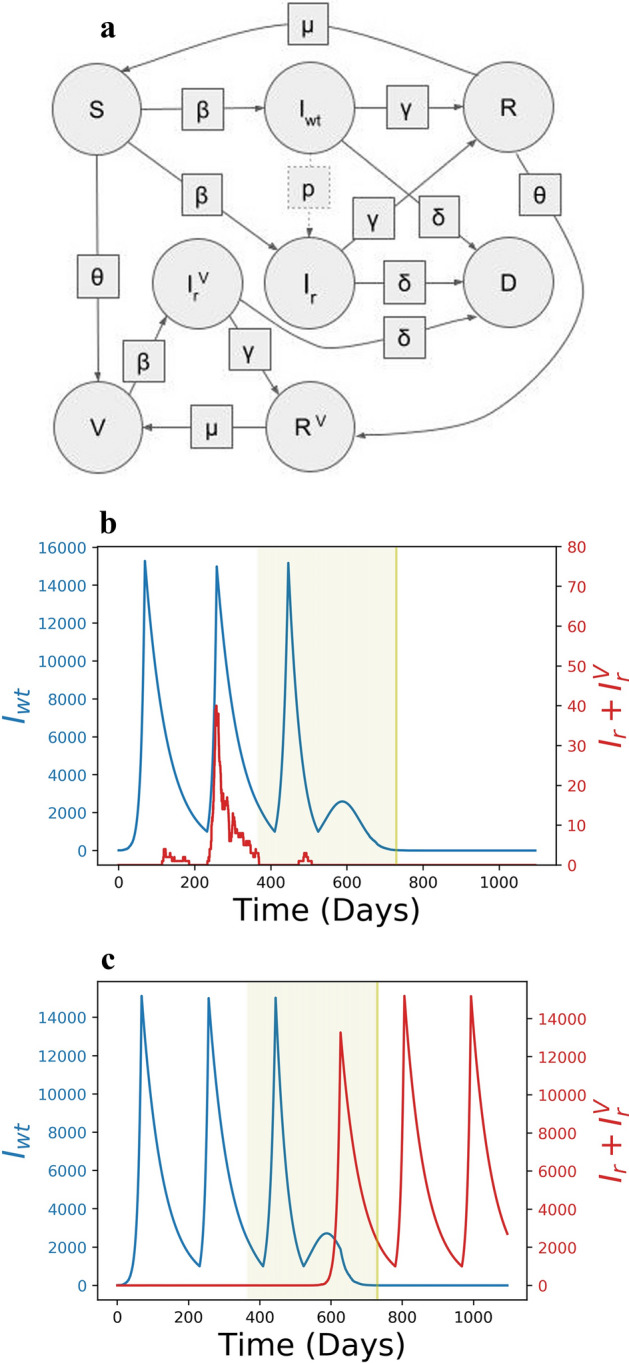
Figure 1.

The states, transition parameters and dynamics. (a) States are shown in circles and transition parameters in squares. The transition parameter, μ, is the rate at which individuals lose natural immunity and p, is the probability that an individual infected with the wildtype strain transmits a resistant strain, so it is not a deterministic parameter. Example dynamics of the number of individuals infected with the wildtype (blue) and resistant strains (red) for p = 10–6, θ0 = 1/365 and Fh = 15,000. The period of vaccination is highlighted (green). Under the same parameters the resistant strain may emerge and go extinct, (b), or become established, (c).
