Figure 2.
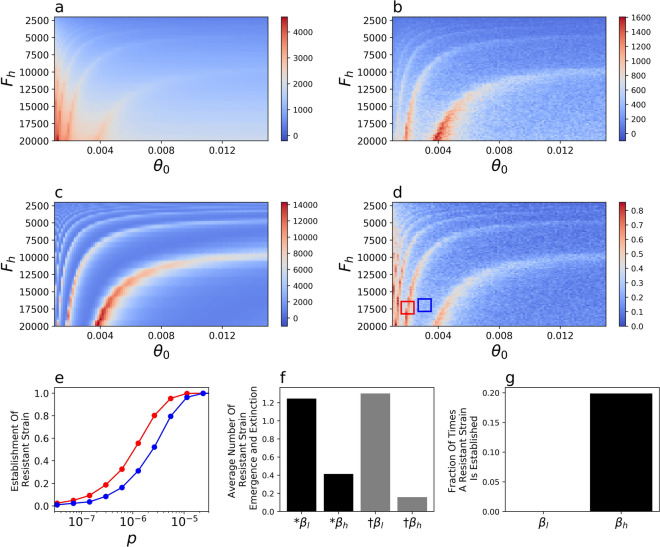
Impact of the rate of vaccination, θ, and the initiation of low rate of transmission, Fh, on model dynamics. The cumulative death rate from the (a) wildtype and (b) resistant strains, (c) the number of wildtype-strain infected individuals at tv60, the point in time when 60% of the population is vaccinated and (d) the probability of resistant strain establishment, for p = 10–6. (e) The probability of emergence of the resistant strain as a function of the probability of emergence, p shown for the parameter ranges of θ and Fh in the corresponding red and blue boxes from figure (d). (f) The average number of times of 8 × 10⁶ simulation runs during which a resistant strain emerges (black) or goes extinct (grey) during periods of low (βl) or high (βh) transmission for p = 10–6. (g) A resistant strain was never observed to establish during periods of low transmission (βl) for p = 10–6.

