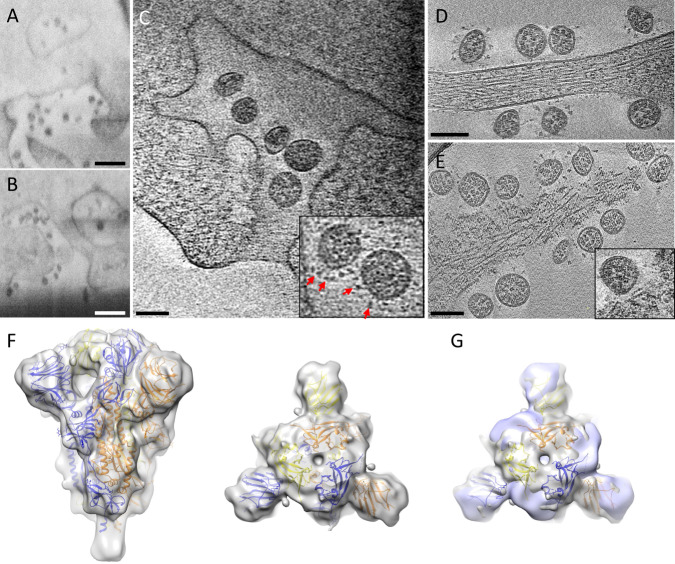
Fig. 5. SARS-CoV-2 egress.
A, B CryoFIB/SEM images of cell periphery, depicting virus particles exiting through extended tunnels connected to external of the cell. C CryoET of the SARS-CoV-2-exiting tunnel. Inset shows a close-up view of viruses with prefusion spikes (red arrows). D, E Viruses released from the cell, close to an intact cell membrane (D) or next to membrane lesion sites (E). Inset, close-up view of a membrane lesion site. F Subtomogram average of spikes on released viruses at 10.6 Å resolution fitted with an atomic model of spike trimer (PDB 6VXX)16, viewed from side and top. G Comparison of spike structures from intracellular assembled viruses (transparent blue) and extracellular released viruses (transparent gray), viewed from top. Scale bar is 300 nm in A, B and 100 nm in C–E.

