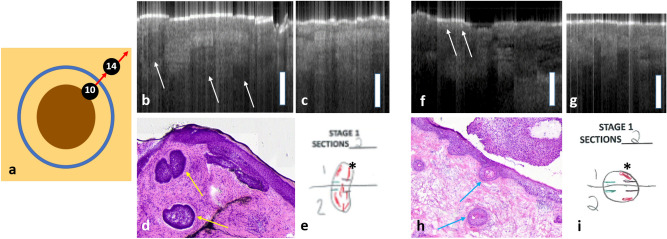
Figure 7.
(a) Model demonstrating the trajectory of the scans displayed in this figure. Scan10 was done across the surgical margin and scan14 was done across adjacent normal skin. (b–e) are results obtained from Patient 1, with BCC on the right neck. (b) Scan10 demonstrates a positive surgical margin: dark nodular structures with a thin, dark border (white arrows). (c) scan14 demonstrates normal skin, with a thinner epidermis and no tumor features. (d) Corresponding Mohs histology demonstrates tumor islands (yellow arrows) in the region of Scan10. (e) Mohs histology documentation, depicting histologically positive Stage 1 margins (asterisk). (f–i) are results obtained from Patient 2, with SCC on the scalp. (f) scan10 demonstrates a positive surgical margin: discrete bright regions within the epidermis (white arrows). (g) scan14 demonstrates normal skin, with a uniform epidermis and no tumor features. (h) Corresponding Mohs histology demonstrates keratin pearls in the region of Scan14 (blue arrows). (i) Mohs histology documentation, depicting histologically positive Stage 1 margins (asterisk).

