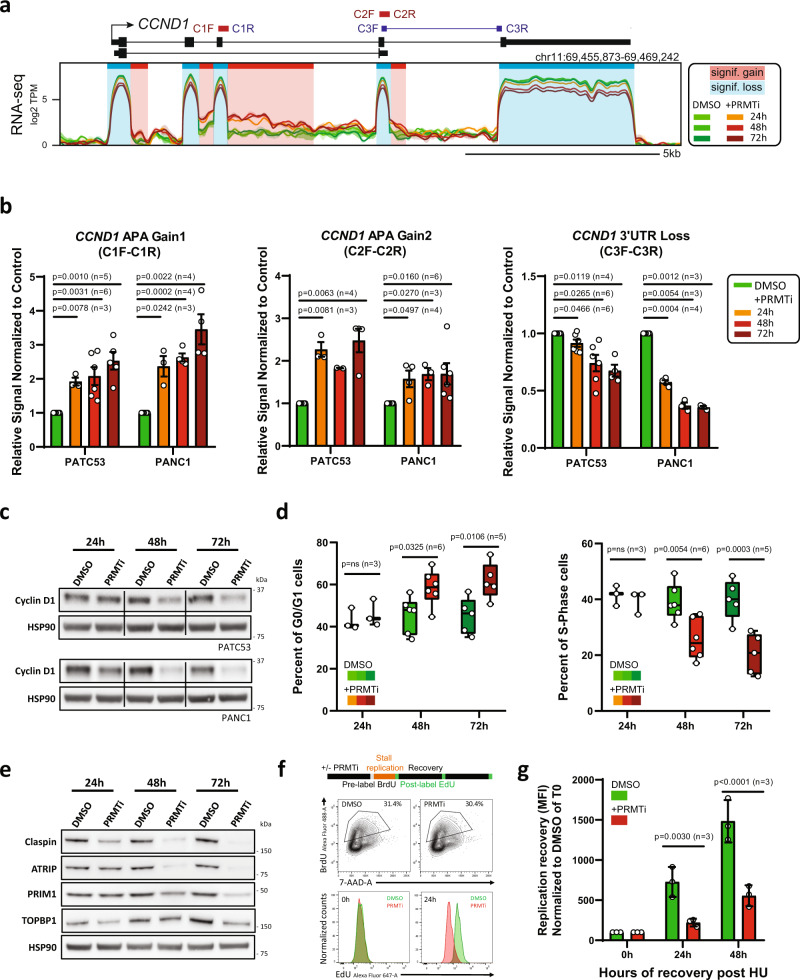
Fig. 5. PRMT1 regulates key pathways involved in cell proliferation and DNA replication.
a Representative composite screenshot of RNA-seq data over CCND1, a gene that undergoes significant alternative polyadenylation gains (shaded red) and concomitant expression loss (shaded blue) in PANC1 cells treated with 1 µM PRMTi or DMSO control. b RT-qPCR validation of alternative polyadenylation in the CCND1 gene using primers indicated in (a) in PATC53 and PANC1 cells treated for 24 h, 48 h, or 72 h with 1 µM PRMTi or DMSO control. Data are presented as the mean ± SEM and p values are calculated by two-tailed Student’s t-test compared to DMSO-treated cells (n=independent experiments). c Western Blot analysis of Cyclin D1 in PATC53 and PANC1 cells treated with 1 µM PRMTi or DMSO control for indicated times. d Cell cycle profile of PATC53 cells treated with 1 µM PRMTi or DMSO control. Percentage of cells present in each cell cycle phase assessed by EdU or BrdU staining. Box-and-whisker plots in the panels depict 25–75% in the box, whiskers are down to the minimum and up to the maximum value, and median is indicated with a line in the middle of the box; p values are calculated by 2-way ANOVA compared to DMSO treated cells for each time point (n=independent experiments). e Western Blot analysis of indicated proteins in PATC53 cells treated with 1 µM PRMTi for the indicated time. HSP90 is shown as the representative loading control. f Replication restart in PATC53 cells treated with 1 µM PRMTi or DMSO control was evaluated by dual-labeling flow cytometry. Top panel: schematic representation of an experimental design. Middle panel: BrdU gating to select replicating cells. Bottom panel: plot showing replication restart as detected by EdU incorporation in BrdU positive cells immediately (0 h) and 24 h (24 h) after HU washout. g EdU incorporation in BrdU-positive cells post HU treatment was monitored by flow cytometry. Mean fluorescence intensity (MFI) of EdU is reported and normalized to 100 for PRMTi treated samples and controls at the time of HU washout (0 h). Data are presented as the mean ± S.D. and p values are calculated by 2-way ANOVA compared to DMSO treated cells for each time point (n=independent experiments). Source data are provided as a Source Data file.

