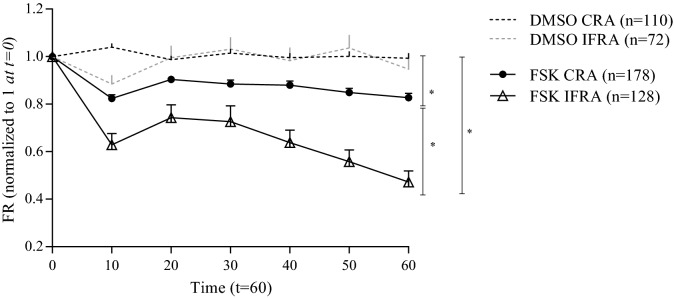
Figure 4.
Cross-sectional areas (CRA) and inner fluid reservoir areas (IFRA) analysis of WT nasospheroids from different healthy WT subjects. Spheres were analyzed by live-cell imaging after DMSO or FSK incubation. Dots and triangles show mean FR values up to 60 min. Bars represent SEM. Both CRA and IFRA results present significant differences between the DMSO and the FSK stimulus. T-test also showed statistically different results for CRA and IFRA (*p = 0.0316; paired t-test). Calculated AUC also showed significant differences between CRA and IFRA trajectories (****p < 0.0001). Similar results were observed after analysing slopes (results showing slopes of the same experiments are available in Supplementary Information). Results were a combination from spheres grown in conditions 1 and 2. Graphic created with GraphPad Prism version 633.

