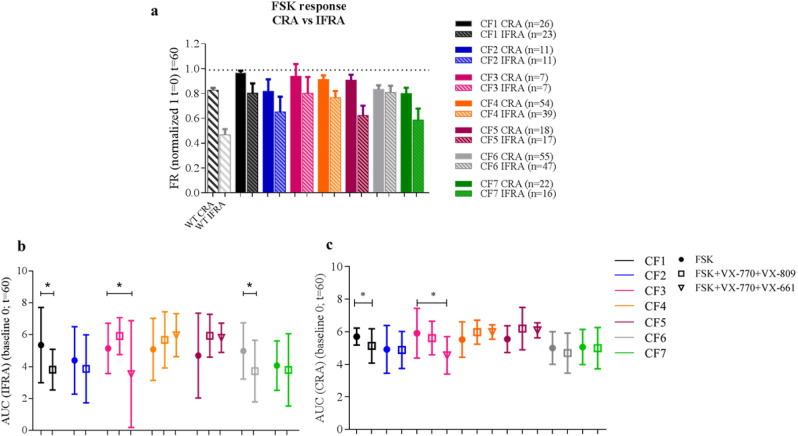
Figure 5.
Inner fluid reservoir areas are more sensitive to categorize between healthy and CF responses after FSK-incubation. Both CRA and IFRA areas were studied in WT and CF subjects after 60 min following FSK-incubation. Each CF subject is represented by a different color. All CF nasospheroids were grown under condition 1. (a) CRA and IFRA DMSO CF values (t = 60) are represented by a dotted line. CF1 and CF2 unrelated patients share the same genotype (F508del/2183AA>G) but show significant different FSK responses (****p < 0.0001) in IFRA analysis. Columns of CF patients represent mean FR values. Bars represent SEM. AUC values after IFRA (b) and CRA (c) assessment were determined by GraphPad Prism (baseline Y = 0) at t = 60 min. Dots represent mean AUC values from FSK-incubated nasospheroids. Empty squares represent mean AUC values of VX-770 + VX-809-treated nasospheroids. Inverted triangles show mean AUC values from VX-770 + VX-661-treated nasospheroids. Bars represent standard deviation (SD). Significant differences (p < 0.05) within VX-treated and FSK-treated nasospheroids are shown. VX-incubation was always combined with FSK, Amiloride and IBMX. Graphic created with GraphPad Prism version 633.

