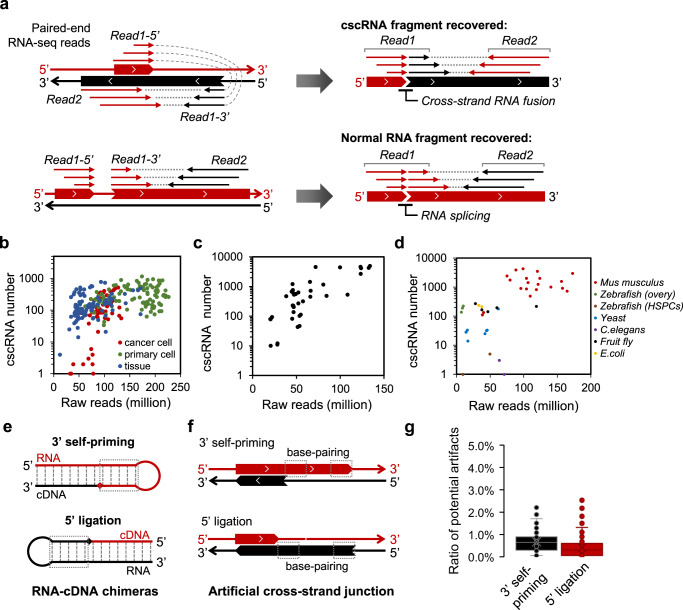
Fig. 1. Identification of the cscRNAs with total RNA PE sequencing datasets.
a Alignment scenarios of the PE RNA-seq reads for identification of the cross-strand RNA fusion events (top) and the regular exon–exon junctions upon RNA splicing (bottom). Top: one end (e.g., read1) of the PE reads were truncated into two fragments, which were mapped to the two opposite reference strands, respectively. The other end (read2) was then mapped to the shifted strand accordingly. Bottom: one end (e.g., read1) of the PE reads were truncated into two fragments, which were mapped to two positions of the same strand, indicating an exon–exon junction upon RNA splicing. The other end (read2) was mapped to the same strand. b The numbers of cscRNAs identified in each of the human RNA-seq datasets from ENCODE, including 54 samples of cancer cell lines, 109 samples of primary cells, and 108 samples of normal tissues. The raw read number of each dataset is shown on the X axis. c The numbers of cscRNAs identified in each of the human RNA-seq datasets from the GEO database. The raw read number of each dataset is shown on the X axis. d The numbers of cscRNAs identified in the datasets of multiple other species, including mouse (20 samples), zebrafish (5), C. elegans (6), fruit fly (5), yeast (7), and E. coli (2). The datasets of mouse are from ENCODE, and all the others are from the GEO database. The raw read number of each dataset is shown on the X axis. e Potential artifacts during reverse transcription due to 3′ self-priming (top) of the template RNA or 5′ ligation (bottom) between the template RNA and the cDNA, both of which generate RNA–cDNA chimeras. f Artificial cross-strand junction events recovered by the RNA-seq reads of the RNA–cDNA chimeras shown in (a). The dashed boxes illustrate the reverse-complementary regions on the same strand, which strongly indicate the potential artifacts during reverse transcription as shown in (a). g Box plots illustrating the percentages of the potential artificial cscRNAs that show signatures of 3′ self-priming or 5′ ligation, in the 271 human samples from ENCODE. As shown in (b), base-pairing for at least 4 bp in the upstream fragment is deemed as a sign of 3′ self-priming, whereas base-pairing in the downstream fragment is a sign of 5′ ligation. The distance between the base-pairing regions was set to be within 100 nt. The median value is shown as the line and the average as the cross. Source data are provided as a Source data file.

