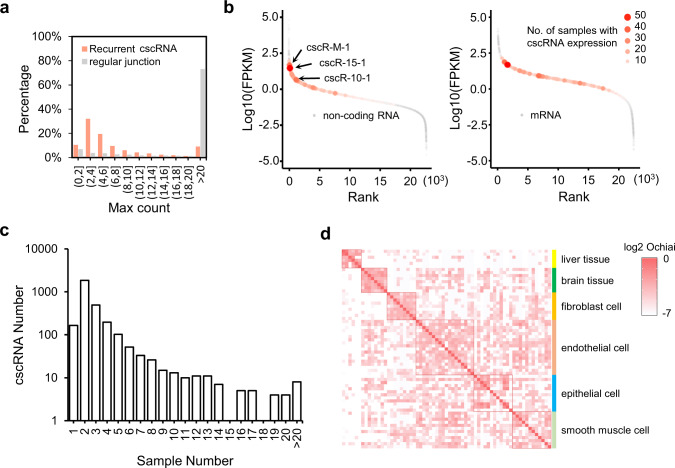
Fig. 2. Expressions of the recurrent cscRNAs.
a Distributions of the maximum RNA-seq read counts, among the 271 human samples from ENCODE, on the cross-strand junction sites of the recurrent cscRNAs or 10,000 randomly selected regular exon–exon junction sites. b The maximum of the FPKMs among the 271 human samples of the recurrent cscRNAs on the background of all the annotated long non-coding RNA (left) or mRNA (right) species. The size of each dot indicates the number of samples in which the cscRNA is expressed. The 3 most frequently found cscRNAs among all the samples are marked on the plot. c Distributions of the numbers of different biological samples in which the recurrent cscRNAs are expressed. d Similarity matrix showing the log2 Ochiai values based on the recurrent cscRNAs shared by some of the 271 human samples from ENCODE. Refer to Fig. S7 for the similarity matrix for all of the 271 samples.

