Figure 6.
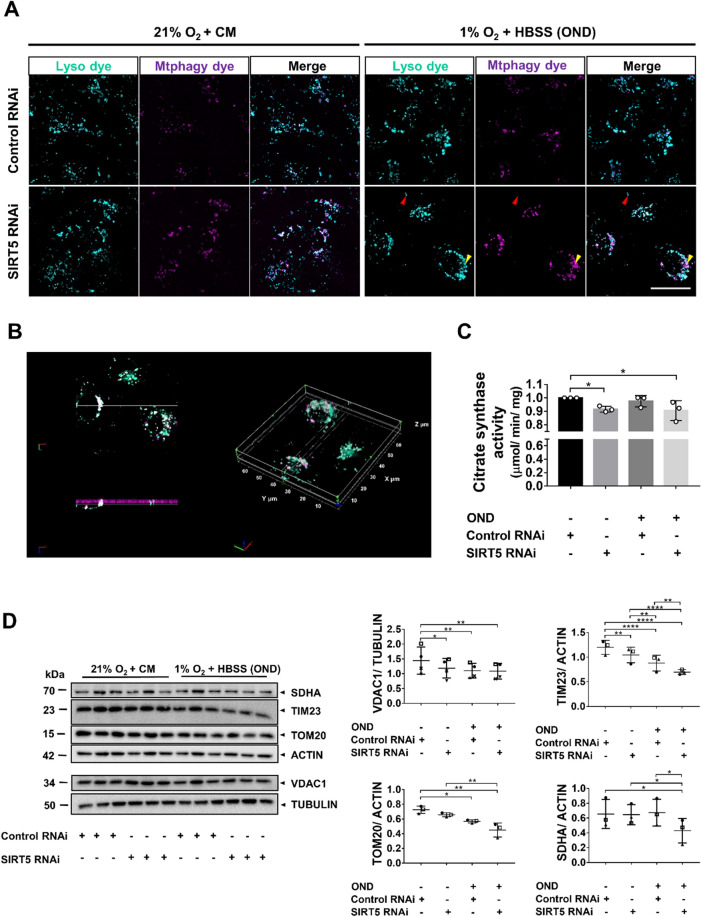
SIRT5-depletion aggravates OND-induced mitochondrial mass reduction. hPTECs were transfected using siRNA against SIRT5 or non-targeting siRNA control. Seventy-two hours post-transfection cells were exposed to 6 h of OND (1%O2 + HBSS) or normoxia and complete medium (21%O2 + CM). (A) Maximum projection laser-scanning confocal micrographs showing lysosomes (cyan; red arrow) and lysosome-engulfed mitochondria (magenta; yellow arrow). hPTECs were incubated with a fluorescent, pH-dependent probe (Mtphagy dye; magenta), exposed to 21%O2 + CM or OND and subsequently, incubated with a lysosomal dye (Lyso dye; cyan). Scale bar: 25 µm. (B) Representative 3D image of engulfed mitochondria (magenta) in lysosomes (cyan). Co-localized areas appear white. Z-stacks were analyzed using Image-Pro Premier 10 (MEDIA CYBERNETICS). (C) Bar graph showing citrate synthase (CS) activity as a measure of mitochondrial mass. CS activity/sample was normalized to total protein content. Data are from three independent experiments with n = 3 technical replicates/group. To determine statistical significance a two-way ANOVA was carried out followed by Tukey’s post hoc test to normalize for multiple comparisons. Data are mean ± SD. *p < 0.05. (D) WB showing protein levels of SDHA, TIM23, TOM20 and VDAC1. Scatter plots showing the densitometric analysis for SDHA, VDAC1, Tim23 and TOM20. VDAC1 was normalized to tubulin and SDHA, TIM23 and TOM20 were normalized to actin. Whole WBs shown in supplementary file (Supplementary Fig. S8g) ImageJ was used for densitometric analysis. Data are from three to four independent experiments with n = 3 technical replicates/group. To determine statistical significance a two-way ANOVA was carried out followed by Tukey’s post hoc test to normalize for multiple comparisons. Data are mean ± SD. *p < 0.05, **p < 0.01, ***p < 0.001 and ****p < 0.0001.

