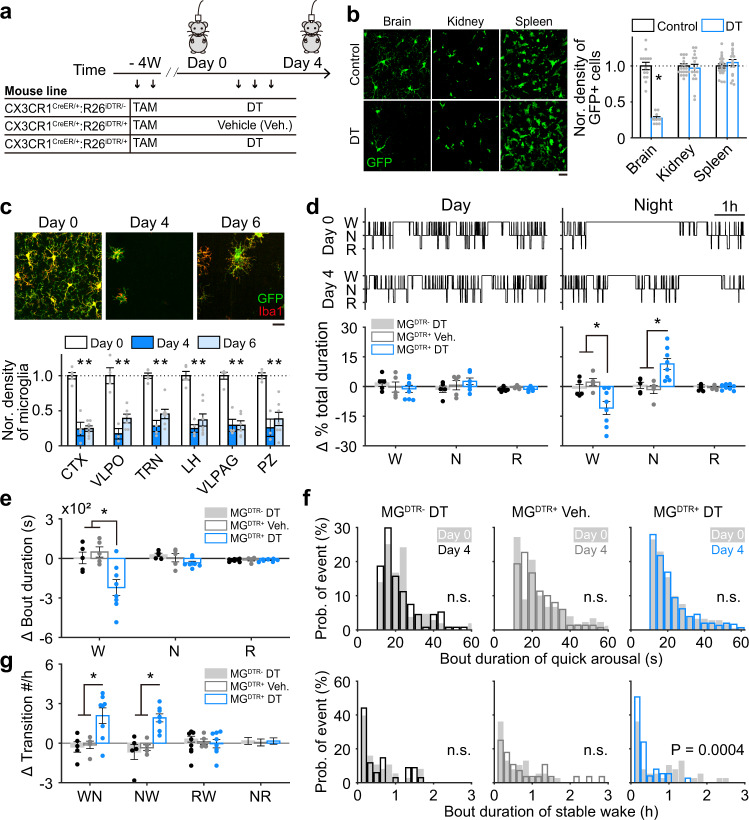
Fig. 1. Microglia are essential for stable wakefulness at night.
a Microglia were noninvasively depleted by injecting DT (i.p.) into CX3CR1Cre-ERT2/+:R26iDTR/+ transgenic mice. EEG/EMG signals were recorded before and after injection for 6 h during the middle of day and night periods. Three groups of mice were included: CX3CR1Cre-ERT2/+:R26iDTR/− mice with tamoxifen (TAM) and DT injection (MGDTR− DT), CX3CR1Cre-ERT2/+:R26iDTR/+ mice with TAM and vehicle injection (MGDTR+ Veh.), CX3CR1Cre-ERT2/+:R26iDTR/+ mice with TAM and DT injection (MGDTR+ DT). b Four weeks after TAM treatment, DT injection sharply decreased CX3CR1-expressing cells in the brain (p = 1.1 × 10⁻¹⁰), with no effect on kidney and spleen of CX3CR1Cre-ERT2/+:R26iDTR/+ mice. Control, 3 mice; n = 14 images from brain, n = 20 images from kidney, n = 22 images from spleen; DT, 2 mice; n = 10 images from brain, n = 16 images from kidney, n = 18 images from spleen, Each dot represents cell density obtained from one image. Scale bar, 20 µm. c DT depleted ~80% of microglia (cells co-labeled with GFP and Iba1) across the whole brain (day 0 vs day 4, p < 0.01 for all examined regions; day 0 vs day 6, p < 0.01 for all examined regions). Representative images show cortical microglia. Microglial density was normalized to day 0 values. CTX cortex, VLPO ventrolateral preoptic nucleus, TRN thalamic reticular nucleus, LH lateral hypothalamus, VLPAG ventrolateral periaqueductal gray, PZ parafacial zone. At least four images were collected for each brain region of one mouse, each dot represents cell density obtained from one mouse. day 0, n = 5 mice; day 4, n = 4 mice; day 6, n = 7 mice. Scale bar, 50 µm. d, e A hypnogram measured from one mouse during the day (top, left) and at night (top, right) before and after microglial depletion (W wakefulness, N NREM sleep, R REM sleep). Sleep architecture (bottom in d: total duration for each state; e: bout duration for each state) was compared before (day 0) and after (day 4) DT or vehicle injection for each animal, and the difference (day 4–day 0) was further compared between three groups of mice. Each dot represents the difference between day 0 and day 4 in one mouse. For ∆ % total duration at night in d; W: p = 0.025 for MGDTR− DT vs MGDTR+ DT; p = 0.005 for MGDTR+ Veh. vs MGDTR+ DT; N: p = 0.008 for MGDTR− DT vs MGDTR+ DT; p = 0.002 for MGDTR+ Veh. vs MGDTR+ DT. For ∆ bout duration in e; W: p = 0.01 for MGDTR− DT vs MGDTR+ DT; p = 0.003 for MGDTR+ Veh. vs MGDTR+ DT. MGDTR+ DT, n = 8 mice; MGDTR+ Veh., n = 5 mice. MGDTR− DT, n = 5 mice. f Microglial depletion shortened wakefulness stability (bottom) but not quick arousals (top) at night. g Microglial depletion enhanced the number of wakefulness to NREM sleep (WN) and NREM sleep-to-wakefulness (NW) transitions at night, the transition from NREM sleep to REM sleep (NR) and REM sleep-to-wake were still intact (RW). WN: p = 0.005 for MGDTR− DT vs MGDTR+ DT; p = 0.008 for MGDTR+ Veh. vs MGDTR+ DT; NW: p = 1.9 × 10⁻⁴ for MGDTR− DT vs MGDTR+ DT, p = 6.2 × 10⁻⁴ for MGDTR+ Veh. vs MGDTR+ DT. MGDTR+ DT, n = 8 mice; MGDTR+ Veh., n = 5 mice. MGDTR− DT, n = 5 mice. *p < 0.05; two-sided unpaired t-test for b, c; one-way ANOVA with Fisher’s post-hoc test for d, e, and g; two-sided Kolmogorov–Smirnov test for f. Data are reported as mean ± SEM. See also Supplementary Figs. 1–3.

